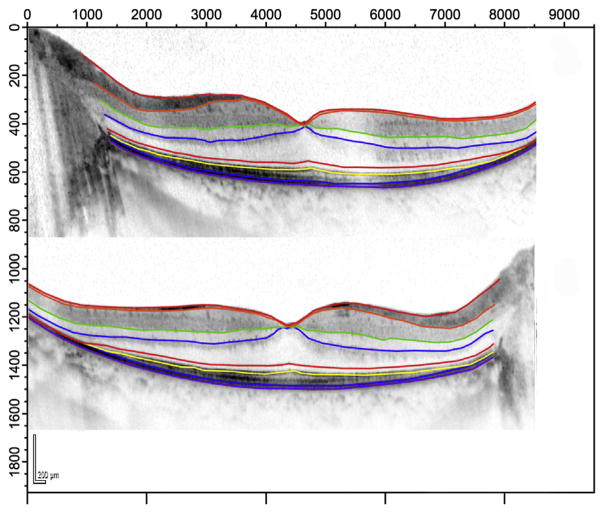
FIGURE 2.
Representative Spectralis spectral-domain optical coherence tomography scans (Heidelberg Engineering, Heidelberg, Germany) from the horizontal midline of a 30-year-old patient with retinitis pigmentosa at 12 months post implant. (Top) Ciliary neurotrophic factor–treated left eye. (Bottom) Sham-treated right eye. Colored lines are borders obtained with Igor segmentation program. Light green: Bruch membrane/choroid border; yellow: ellipsoid zone (inner/outer segment border); blue: inner nuclear layer/outer plexiform layer border.

