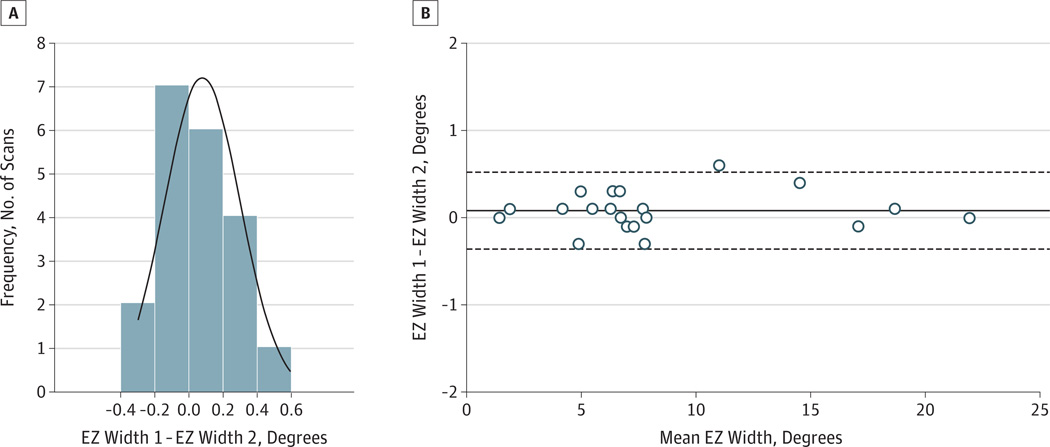
Figure 4.
Test-Retest Differences
A, Test-retest differences were normally distributed with a mean of 0.08° (solid curve shows fit of Shapiro-Wilk normality test to distribution of widths [n = 20]). EZ indicates inner segment ellipsoid zone (inner/outer segment border). B, The magnitude of the test-retest difference for EZ was independent of the mean EZ width.

