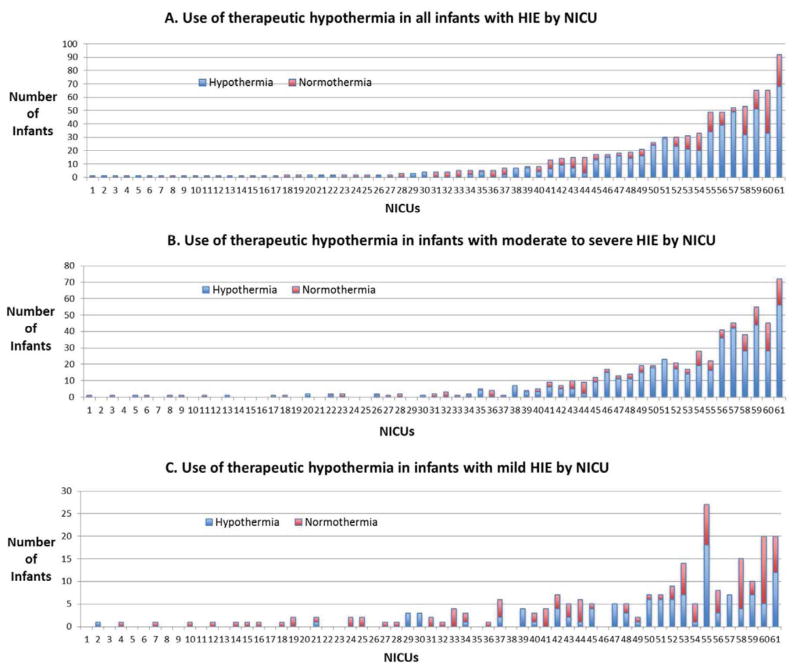
Figure. Hospital Variation in Practice.
Each individual NICU is represented in the X-axis. Infants with HIE are represented in the Y-axis. Each number on the X-axis corresponds to the same NICU.
The total number of patients receiving hypothermia at an individual center ranged from 1 to 68, with 12 centers providing hypothermia therapy to more than 20 patients over the study period. The hypothermia treatment rate for infants with mild HIE varied from 0 to 100%, with a range of 1 to 18 infants. There were 6 centers that treated 100% of their infants with mild HIE (range of 1–7 infants per center). For patients with moderate or severe HIE, 569 (96%) infants were cared for at a cooling center, of which 445 (78%) infants received hypothermia therapy. The hypothermia treatment rate for infants with moderate or severe HIE per center varied from 0 to 100% (rage of 1–56 infants per center), with 16 centers not providing therapy to any of their infants (range of 1 to 4 infants per center).

