
Fig. 5.
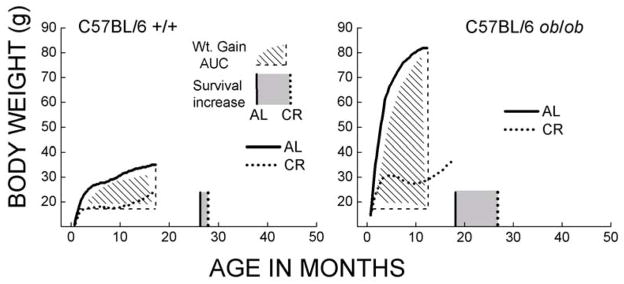
Body weight and longevity extension by caloric restriction in the female C57BL/6 ob/ob congenic and normal mice (re-plotted from [87]). The shaded area represents the cumulative weight gain under AL feeding starting at 1 months of age until the peak body weight was reached. Median age of survival under AL and CR conditions is shown, respectively, as solid and dotted vertical lines along the x-axis. The grey area in between these two lines represents the increase in longevity resulting from CR. Note that increases in body weight under AL feeding as well as the CR-related increase in longevity were much greater in the ob/ob than in the normal mice. This pattern is similar to that shown in Figures 2–4.