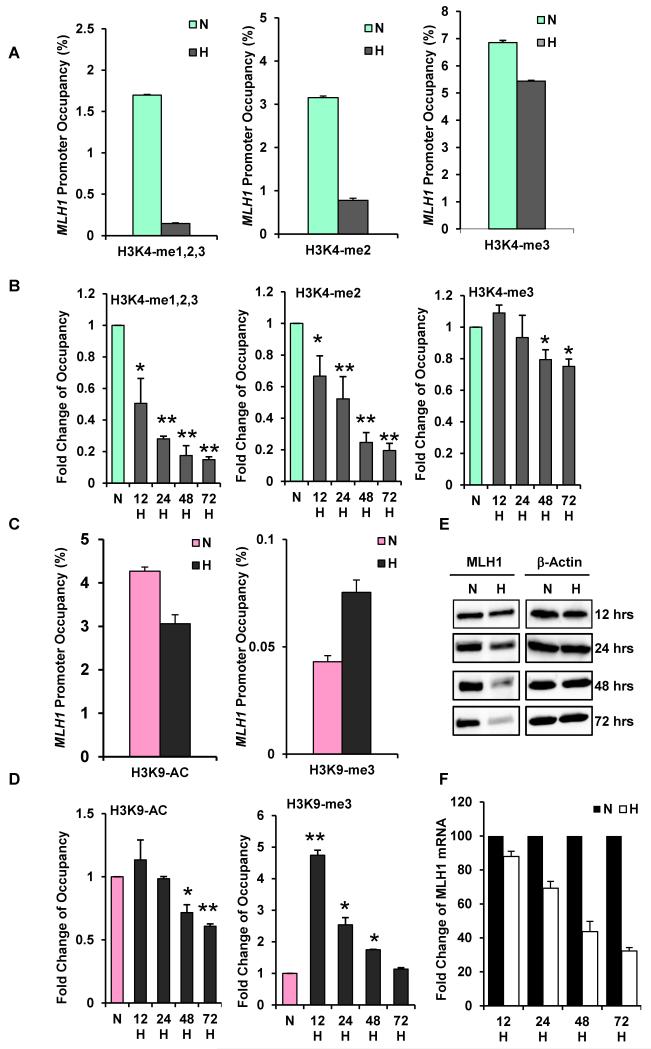
Fig. 1. Hypoxia-induced histone modifications at the MLH1 promoter, accompanied by down-regulated MLH1 expression.
MCF-7 cells were exposed to normoxia (N) or to hypoxia at 0.01% O2 (H) for various times. Cells were collected for quantitative ChIP analyses using specific antibodies to determine H3K4 methylation levels and H3K9 acetylation and methylation levels at the MLH1 promoters. (A) Decreased H3K4 methylation levels at the MLH1 promoter in response to 48 h of hypoxia. Specific antibodies were used to determine specific H3K4 methylation forms. Relative promoter occupancies (% input) are shown with error bars based on standard errors (SEs) calculated from at least three replicates. The input signal is set as 100% (not depicted in graphs) for each assay. (B) Time-course assay of H3K4 methylation changes at the MLH1 promoter. MCF-7 cells placed under hypoxia were collected at the indicated times for qChIP analysis. Promoter occupancy levels are expressed as the fold change relative to normoxia, based on three independent ChIP assays, with error bars based on SEs. Significant differences were identified as p<0.05 (as indicated by *) or p<0.01 (as indicated by **) compared to normoxic levels. (C) Hypoxia increases H3K9 methylation and decreases H3K9 acetylation at the MLH1 promoter. qChIP analysis of H3K9 acetylation (left) and methylation (right) levels at the MLH1 promoter after 48 h normoxia or hypoxia exposure. Relative promoter occupancies (% input) are shown with error bars calculated as above. (D) Time course of hypoxia-induced H3K9 acetylation (left) and methylation (right) at the MLH1 promoter by qChIP analysis. MCF-7 cells were exposed to normoxia or hypoxia for the indicated times, and H3K9 acetylation and methylation levels at the MLH1 promoter were analyzed as above. (E) Time-course of MLH1 expression at the protein level determined by western blot analysis in MCF-7 cells. Cells were exposed to normoxia (N) or hypoxia (H) for the indicated times, and were collected for western blot analysis. (F) Time-course of MLH1 mRNA expression by quantitative real-time PCR analysis (qRT-PCR). mRNA levels are expressed as the fold change relative to those of the corresponding normoxic control cells at each time point.

