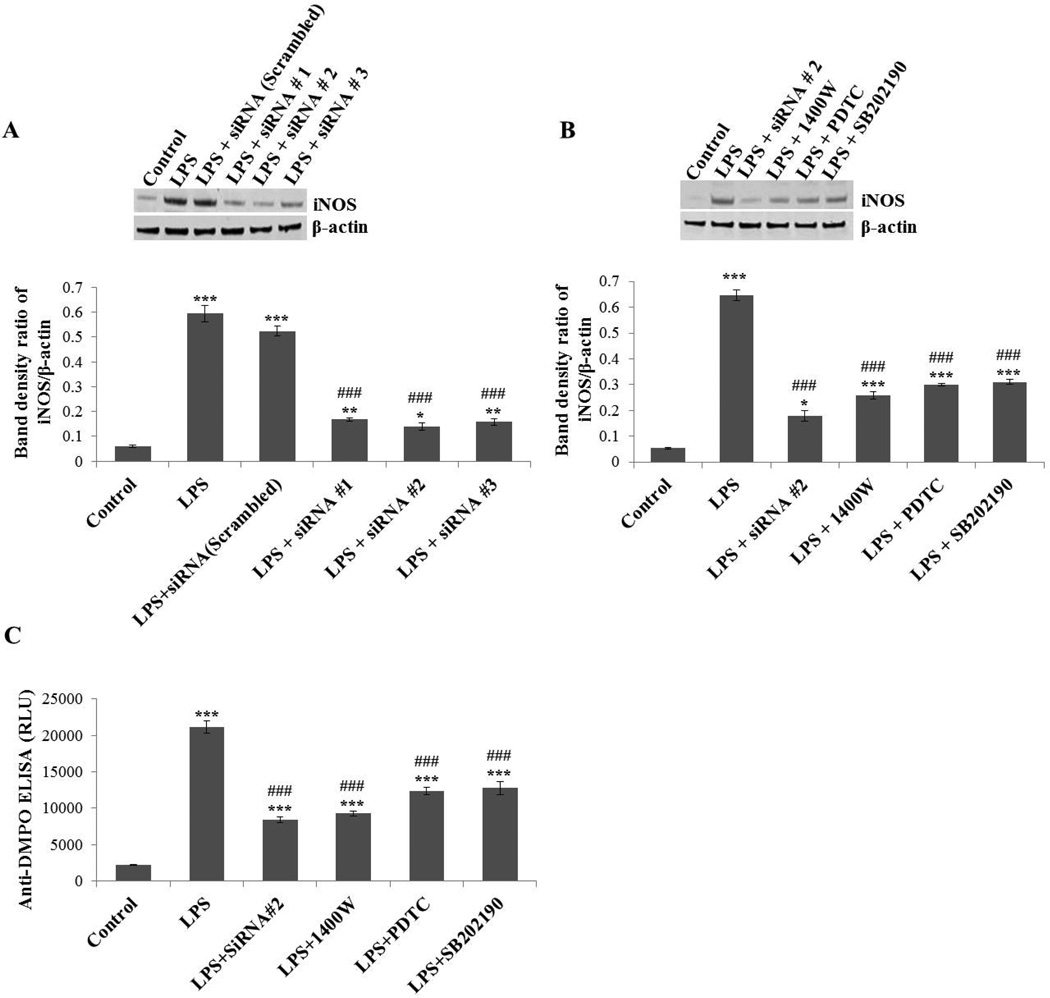
Figure 6.
Effect of iNOS inhibition/silencing on LPS-induced protein oxidation in BV2 cells. (A) BV2 cells were transfected with siRNA1, 2, 3 of iNOS or control (scrambled) siRNA. Forty-eight hours later, cells were incubated with LPS (500 ng/ml) for 24 hours and then harvested for Western blot. The upper panel shows a Western blot of iNOS and the lower panel shows the band density ratio of iNOS and β-actin. (B) BV2 cells transfected with most effective siRNA#2 for iNOS or cells exposed to direct (1400W) or indirect (PDTC, SB202190) inhibitors of iNOS were analyzed by Western blot (upper panel). The lower panel shows the band density ratio of iNOS and β-actin. (C) Anti-DMPO ELISA of BV2 cells treated with 500 ng/ml LPS and 50 mM DMPO for 24 hours in the presence and absence of iNOS silencing/inhibition. Data show mean values ± SEM or representative images from three independent experiments (n=6). (*P<0.05, ** P<0.01, *** P<0.001, with respect to control, and ### P<0.001, with respect to the LPS-treated group.

