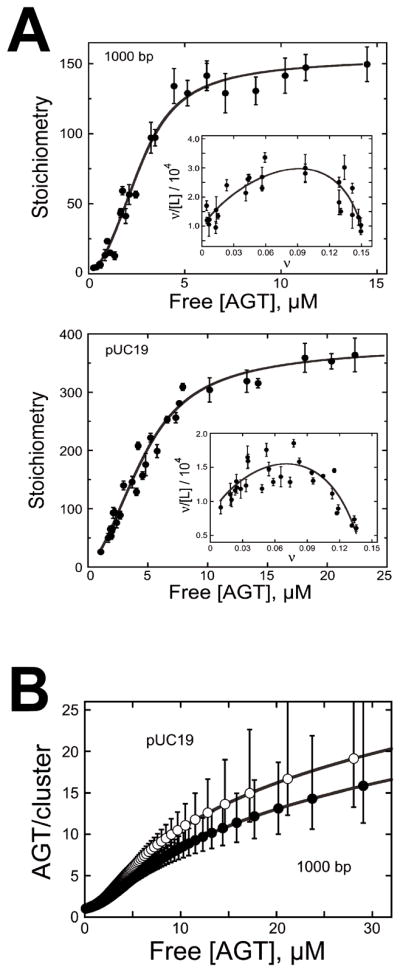
Figure 3. Measurement of binding parameters and prediction of cooperative cluster sizes.

[7] (A) Dependence of binding stoichiometry on free AGT concentration for the 1,000 bp fragment (upper panel) and linear pUC19 DNA (lower panel). Stoichiometries were inferred from weight-average molecular weights measured at sedimentation equilibrium. Error bars are 95% confidence limits for the individual parameters. The smooth curve is an isotherm calculated with Eq. 1 using parameters determined from the Scatchard plots (insets). Insets: The solid curves are fits of Eq. 1, returning K = 9667 ± 1499, ω = 35.9 ± 6.8 and s = 6.32 ± 0.12 for binding the 1,000 bp fragment and K = 7960 ± 916, ω = 44.2 ± 3.8 and s = 6.81 ± 0.14 for binding linear pUC19 DNA. (B) Ranges for C̄ (AGT/cluster) were calculated with Eq. 2 using values of ν, ω, and s and corresponding error ranges determined from Scatchard plot fits (shown in (A)).
