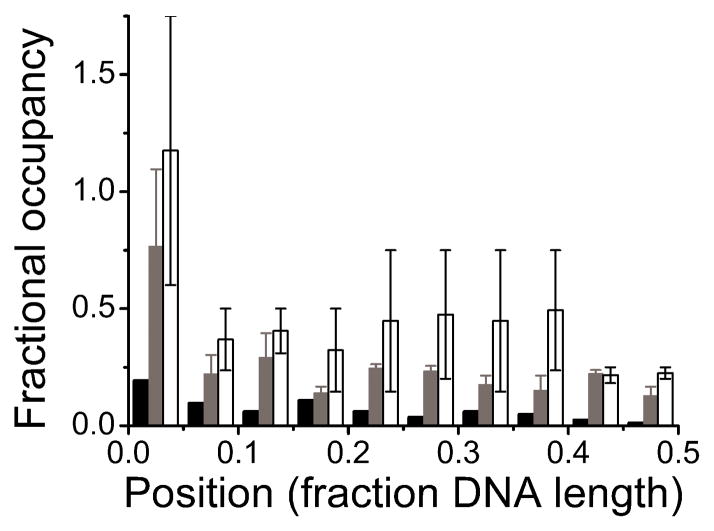
Figure 6. Distributions of AGT clusters on 1,000 bp DNA.
Elevated binding densities at ends reflect preferential interactions. Away from the ends, uniform binding densities are incompatible with DNA sequence or base-composition preference. Because the unmodified DNA ends used in these experiments cannot be distinguished, locations are reported in units of DNA length from 0% (at a DNA end) to 50% (at the DNA center). Low and high [AGT] correspond to incubations at 2 μM (grey, 2.6 +/− 0.3 peaks per DNA, n = 220), and 12 μM AGT (white, 4.6 +/− 2.2 peaks per DNA, n = 159), respectively. For comparison, DNA in the absence of protein is shown (black, 0.7 peaks per DNA, n = 54), demonstrating a low background, likely due to salt contaminations on the DNA.

