
Figure 3. The integrity of mitochondrial morphology.
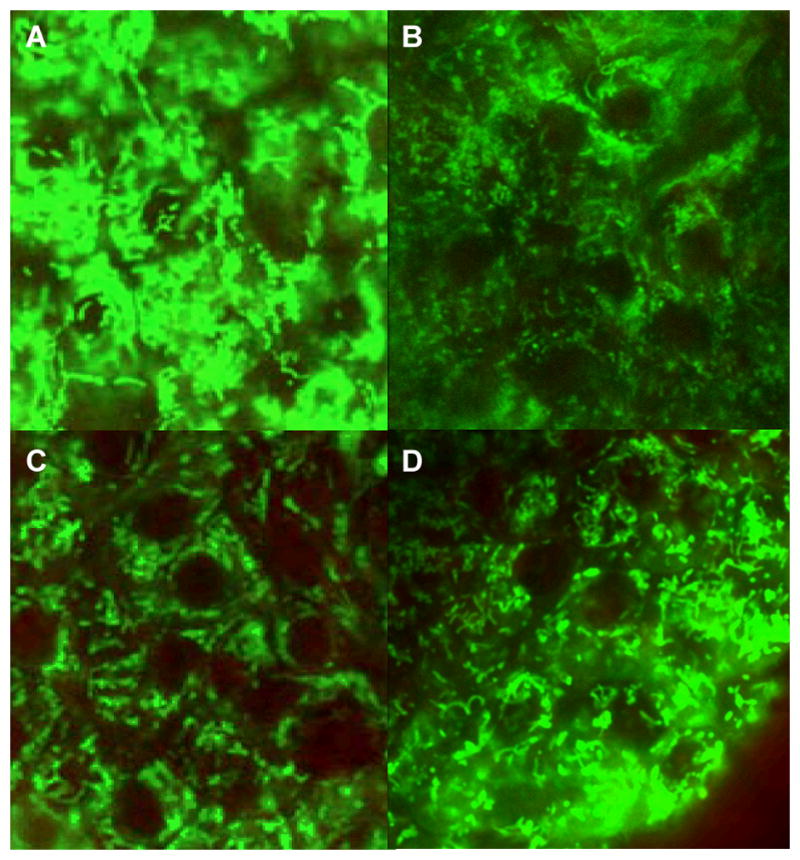
Two representative confocal images of Rh 123-stained islets from the UW group (A,B) and the UW + DZ group (C,D). Contrast has been balanced to reveal the details of mitochondrial morphology. N = 3–4 for each experimental condition, 10–20 islets/group. Scale bar = 5 nm.