
Figure 5. Intracellular calcium concentration responses to glucose and KCI.
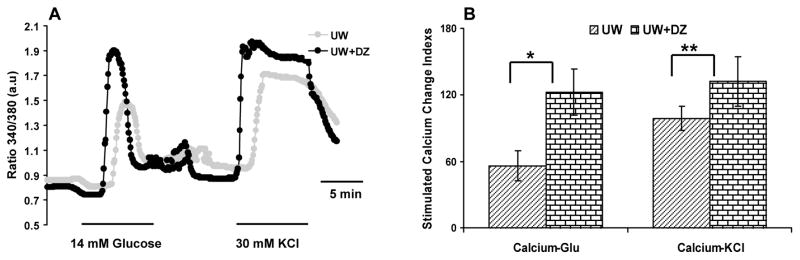
A: Representative record of islet responses from the UW + DZ and the UW groups. Islets were loaded with 5 μM Fura 2-AM and then stimulated with 14 mM glucose and 30 mM KCI. Calcium changes are reflected by the ratio changes of 340/380 nm. The responses of 15–30 islets tested in both groups are recorded. Fig. 5B shows the delta [Ca2+]glu and [Ca2+]KCI of the UW + DZ and the UW groups. * and ** p < 0.05.