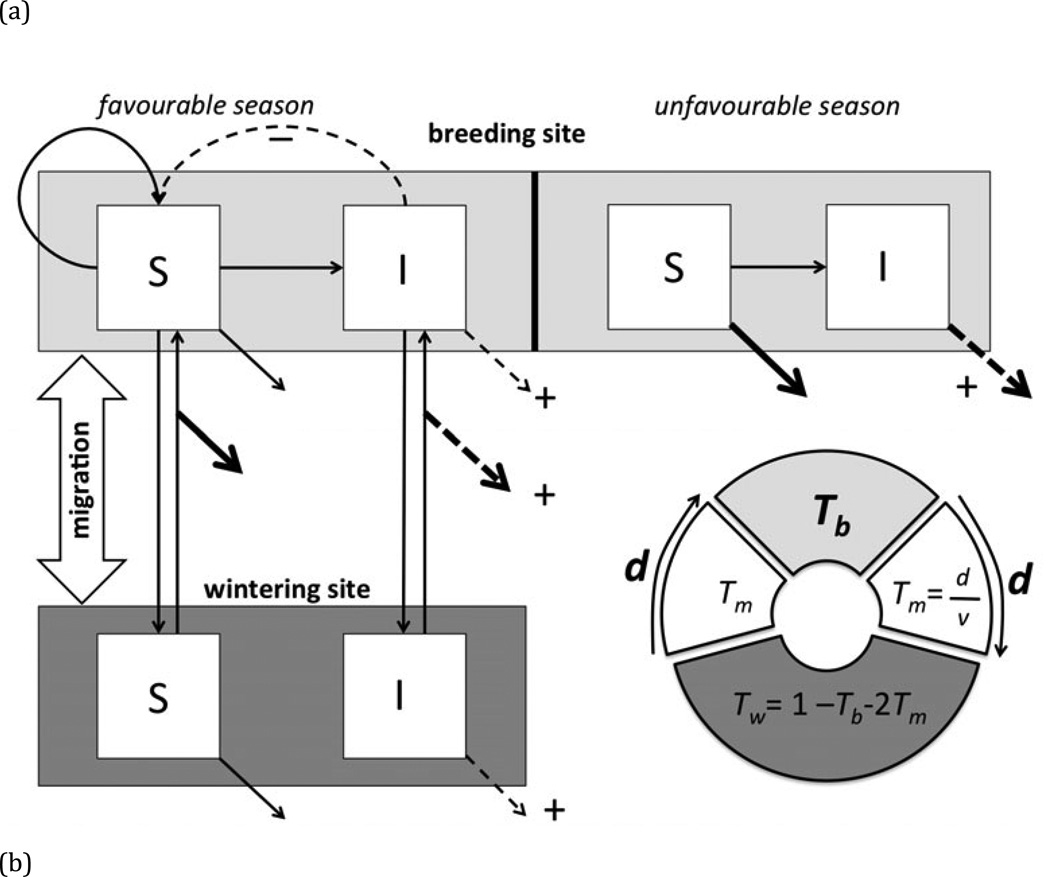
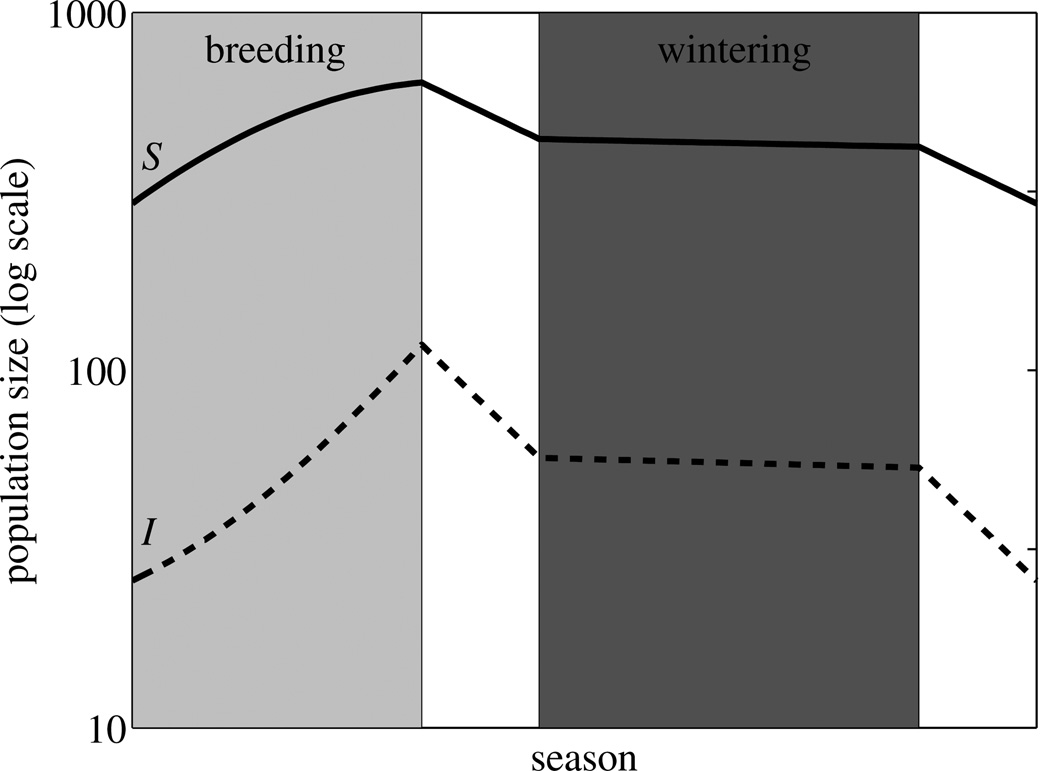
Fig. 1.
(a) Schematic diagram of model showing Susceptible (S) and Infected (I) individuals of a migratory species at the breeding site (light gray shading), during migration, and at the wintering site (dark gray shading). Pathogen transmission (horizontal arrow) occurs only at the breeding site. Curved arrows represent fecundity, vertical arrows represent movement between the breeding and wintering sites, and diagonal arrows represent mortality at each stage of the migratory cycle. Thicker arrows indicate those portions of the migratory cycle during which mortality is expected to be relatively high, and dashed arrows indicate vital rates that are likely to be influenced by infection, with a plus or minus sign depicting whether infection increases or decreases the corresponding vital rate in infected individuals. The circle depicts the proportions of the annual cycle spent at the breeding site (Tb), on a one-way migration (Tm), and at the wintering site (Tw). The dependence of these times on the two key parameters determining the migratory strategy (time spent at breeding site, Tb, and distance migrated, d, depicted in bold) is shown. (b) Example population dynamics (plotted on a log scale) of susceptible (bold line) and infected (dashed line) individuals employing a migratory strategy of Tb=0.33 yr, and d=2.66 × 10³km, and infected with a pathogen with transmission rate β =0.01, and which induces a moderate cost to migratory survival (cm=0.5); the remaining parameter values are listed in Table 1.


