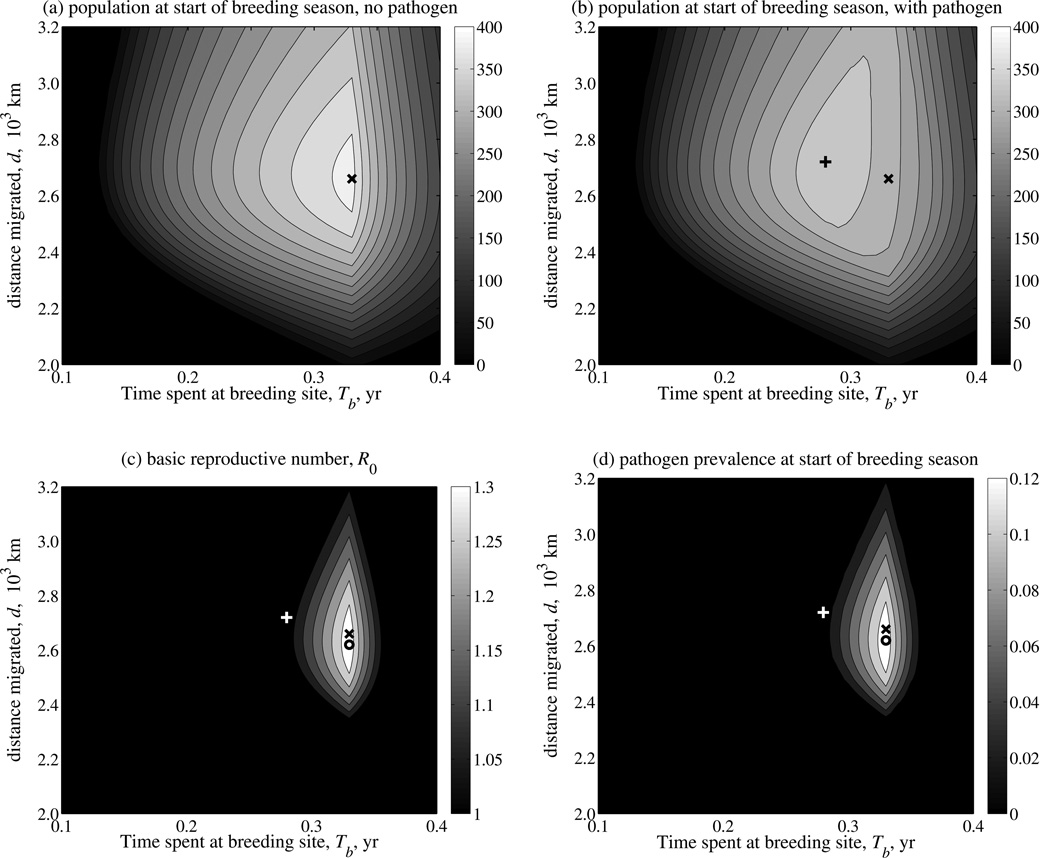
Fig. 2.
Effect of migratory strategy on host population size (a) before and (b) after introduction of a pathogen, and on pathogen invasion success as characterized by (c) the basic reproductive number, R0, and (d) equilibrium pathogen prevalence. The migratory strategy is characterized by the time spent at the breeding site (Tb, horizontal axis) and distance migrated (d, vertical axis), and the magnitude of each response variable is depicted by contour lines and the gray scale bar. The equilibrium population size, N, and pathogen prevalence, I/N, are measured at the start of the breeding season (t=0). The ‘x’ marks the migratory strategy that maximizes the population size prior to pathogen introduction, the ‘+’ marks the strategy that maximizes population size following pathogen introduction and the ‘o’ marks the strategy that maximizes both R0 and equilibrium pathogen prevalence. Results are illustrated for a pathogen with transmission rate β =0.01, and which induces a moderate cost to migratory survival (cm=0.5); the remaining parameter values are listed in Table 1. The contours in each plot are imputed; the raw values are plotted in Supplementary Material A5.

