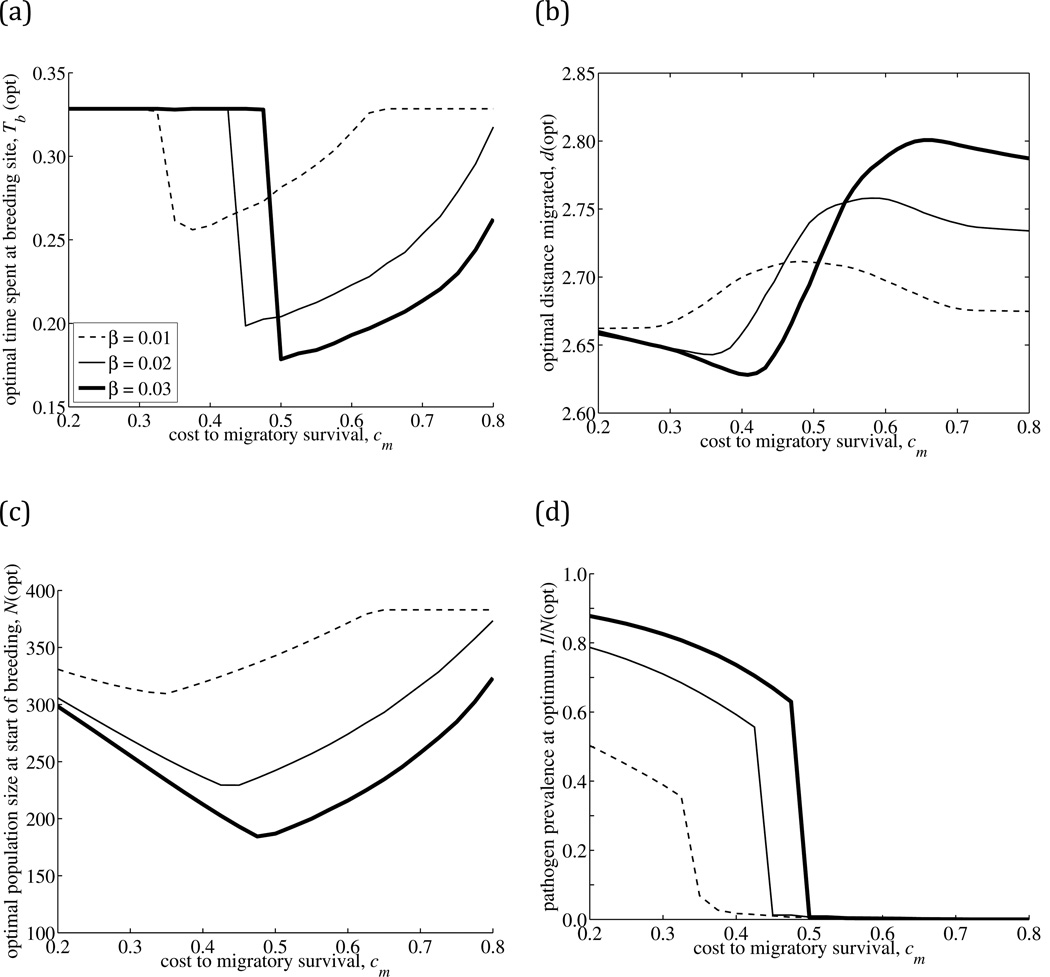
Fig. 3.
The migratory strategy that maximizes population size following pathogen introduction, as a function of two key pathogen traits: the cost-of-infection to migratory survival (cm), and three values of transmission rate (β): low (β =0.01, dashed line), intermediate (β =0.02, thin line) and high (β =0.03, thick line). The response variables for the optimal migratory strategy are (a) time spent at breeding site (Tb), (b) distance migrated (d), (c) equilibrium host population size (N) and (d) equilibrium pathogen prevalence (I/N) measured at the beginning of the breeding season. To account for numerical error in the calculation of the optimum, the lines plotted correspond to the mean values of the top ten strategies for (a) Tb, (c) N and (d) I/N, and a loess regression of d on cm with smoothing parameter 0.3. The range of values of the top ten optimal strategies is shown in Supplementary Material A5. The remaining model parameters are listed in Table 1.

