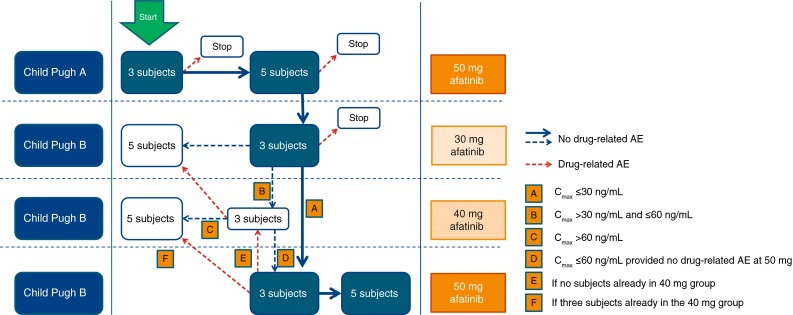
Fig. 1.

Planned inclusion and dosing progression for hepatic impaired subjects according to assessment of adverse events (AEs) and exposure (C max) for afatinib measured by interim pharmacokinetics. AE adverse event. The bold lines indicate the trial pathway if there was no drug-related toxicity and plasma exposure (C max) did not exceed defined thresholds. Dotted lines indicate stopping points if drug-related toxicity was observed. Thin lines indicate alternative trial pathways. The flow chart does not display the inclusion of matched healthy subjects
