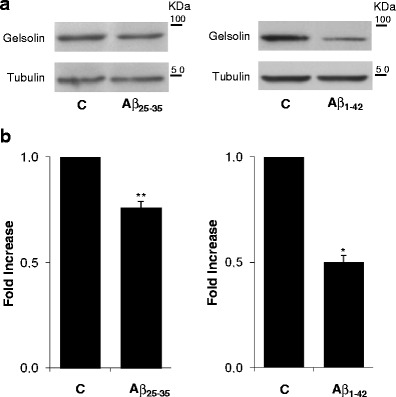
Fig. 4.

Gelsolin levels in response to Aβ. HeLa cells were incubated for 24 h with Aβ25–35 and Aβ1–42, both at 10 μM and aggregated. a Intracellular gelsolin levels were monitored by Western blot analysis using anti-gelsolin antibody. Tubulin was used as an internal control. b Quantitative results are expressed as a fold increase relative to the basal levels. C control. * P < 0.05 and ** P < 0.01, significantly different from control; One sample t test
