
Figure 2.
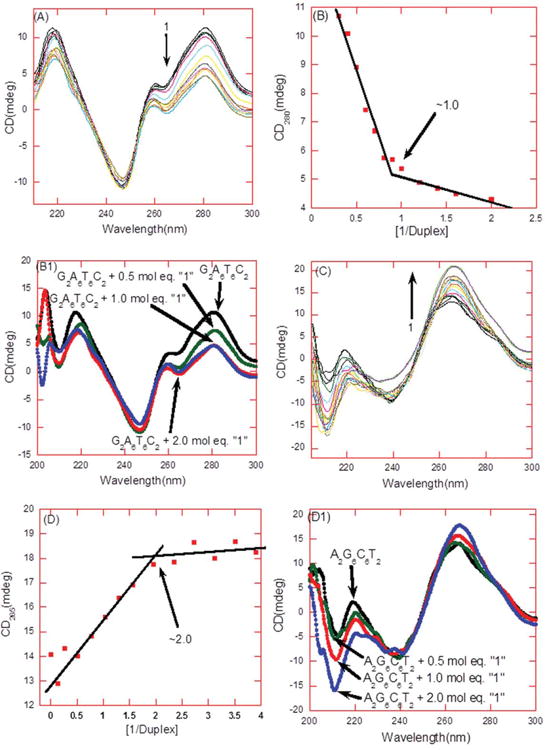
(A) CD titration of d[5′-G2A6T6C2-3′] in the presence of 1. From top to bottom at 280 nm the CD intensity decreased with an increasing amount of 1. (B) The plot between changes in CD intensity (at 280 nm) as a function of the molar ratio of 1 to the DNA duplex. The continuous lines in the plot reflect the linear least squares fit of each apparent linear domain of the experimental data (filled squares) before and after the apparent inflection point. The inflection point corresponds to the binding site size. (B1) CD scans display a change in the CD intensity at stoichiometry ratio (drug/DNA) of 0, 0.5, 1.0, and 2.0. (C) CD titration of d[5′-G2A6T6C2-3′] in the presence of 1. From bottom to top at 265 nm the CD intensity increased with an increasing amount of 1. (D) The plot between changes in CD intensity (at 265 nm) as a function of the molar ratio of 1 to the DNA duplex. The continuous lines in the plot reflect the linear least squares fit of each apparent linear domain of the experimental data (filled squares) before and after the apparent inflection point. The inflection point corresponds to the binding site size. (D1) CD scans display a change in the CD intensity at stoichiometry ratio (drug/DNA) of 0, 0.5, 1.0, and 2.0. Buffer condition: 100 mM KCl, 10 mM SC, 0.5 mM EDTA, and pH =5.5. T = 25°C. [DNA] = 4 :M/duplex.