
Figure 8.
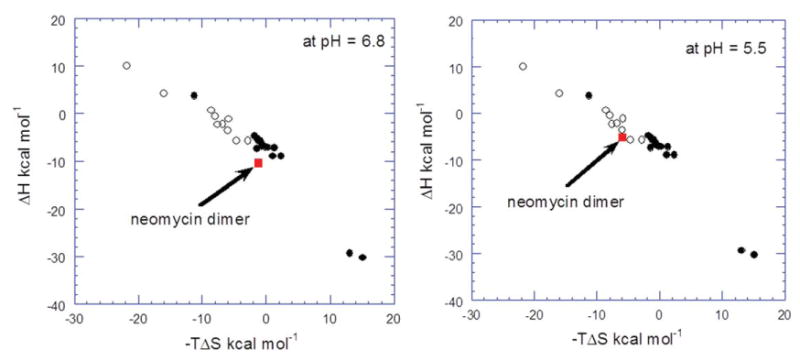
The energy compensation plot of DNA-drug interaction. The filled squares illustrate the energy compensation plot of intercalators and the open squares represent the data for groove binders. 1 is represented by the red square for comparison. The energy compensation data of 1 with the DNA duplex d[5′-G2A6T6C2-3′] compared at both pH readings. The figure is adapted and modified from the work of Chaires (59).