
Figure 3.
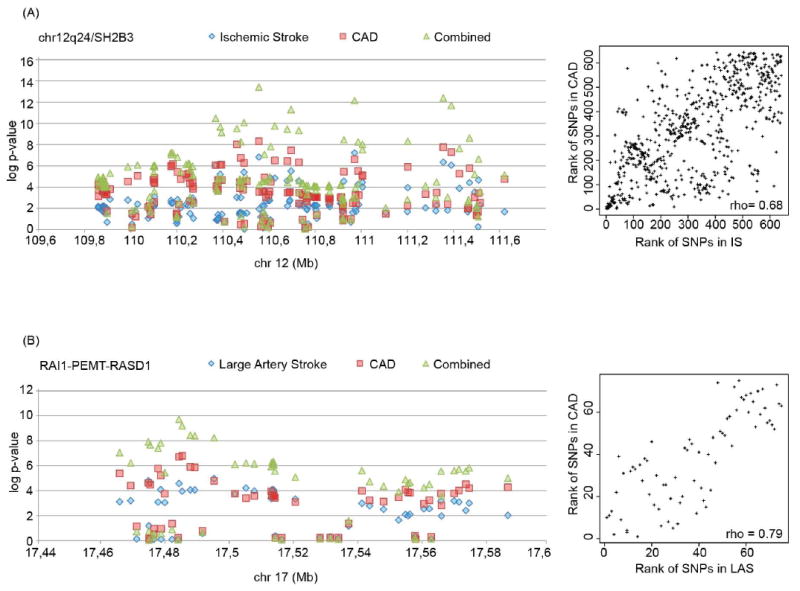
Regional association plots (left) and corresponding Spearman correlation plots (right) of p-values for individual variants of (A) the chr12q24/SH2B3 locus for IS and CAD and (B) the RAI1-PEMT-RASD1 locus for LAS and CAD. For clarity, only a subset of variants is displayed (see Supplementary Figure II for all variants). Data were drawn from METASTROKE and CARDIoGRAM.