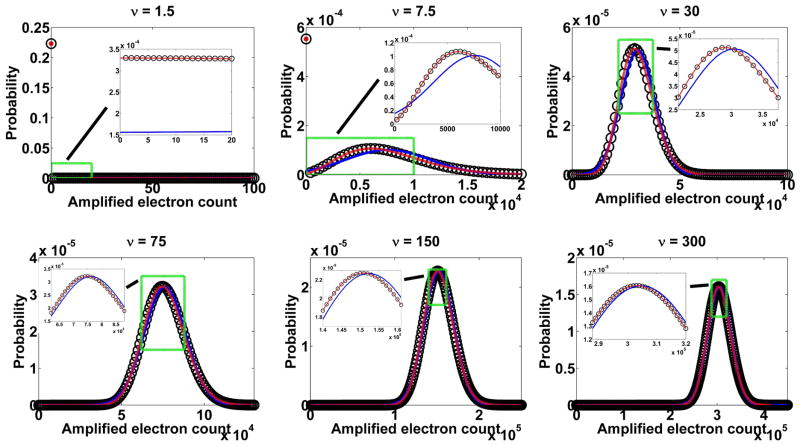
Figure 1.
Probability mass function (Eq. 2) of X536, the electron count at the output of a 536-stage branching process with a standard geometric (○) model of multiplication and a mean gain of m536 = 1015.46, for six different values of the mean ν of the Poisson-distributed initial electron count. For each value of ν, the probability density functions resulting from the high gain approximation (Eq. 8) (red curve) and the Gaussian approximation (Eq. 11) (blue curve) of the output of the standard geometric multiplication are also shown.

