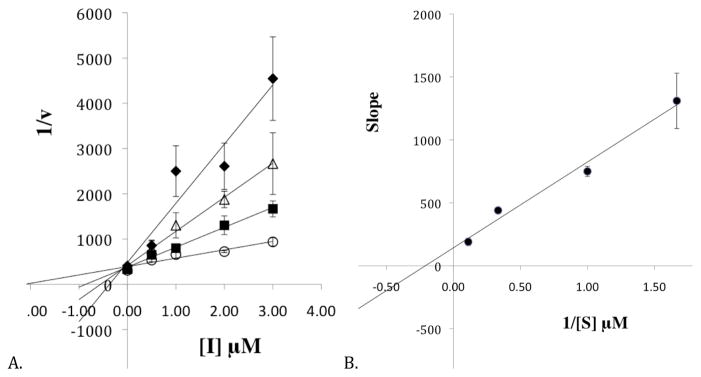
Figure 2.

A. The Dixon plot of the primary data from the steady state inhibition kinetic experiments of h12-LOX and 15-oxo-ETE. The substrate concentrations are 0.6 μM (closed diamonds), 1 μM (open triangles), 3 μM (closed squares) and 9 μM (open circles). B. The Dixon replot of slope vs. [Inhibitor] yielded a Kic of 0.087 ± 0.008 μM and a Kiu of 2.1 ± 0.8 μM. All experiments were done in triplicate with averages and SD presented.
