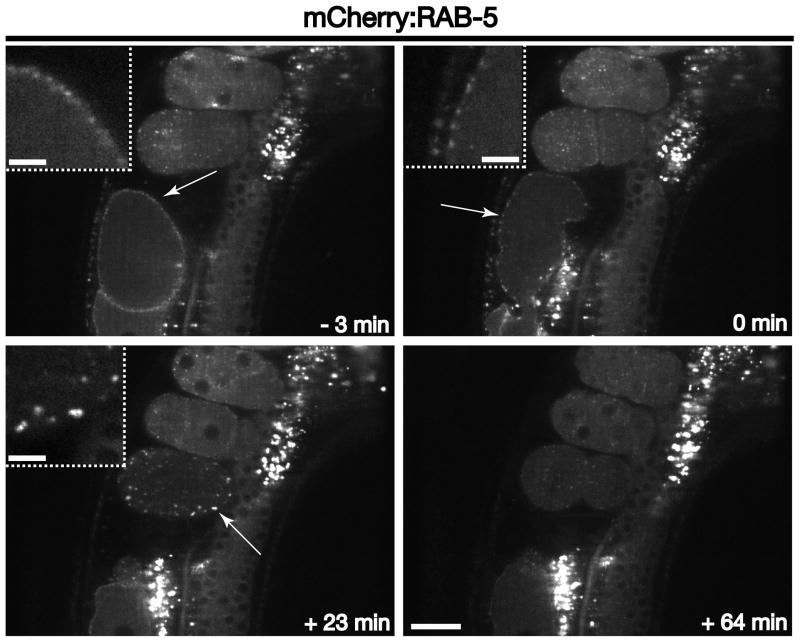
Figure 3. RAB-5 dynamics during early zygotic development.
Individual images of mCherry:RAB-5 illustrate its distribution at various times relative to zygote ovulation. Arrows highlight RAB-5 accumulation on early endosomes near the plasma membrane. Note the increased RAB-5 intensity on enlarged early endosomes during the second wave of clathrin-mediated endocytosis (+23 min timepoint), as compared to endosomes labeled with RAB-5 in later stage embryos. Insets are 3x zoomed views of the areas highlighted by arrows. Scale bar, 20 μm. Inset scale bars, 5 μm.

