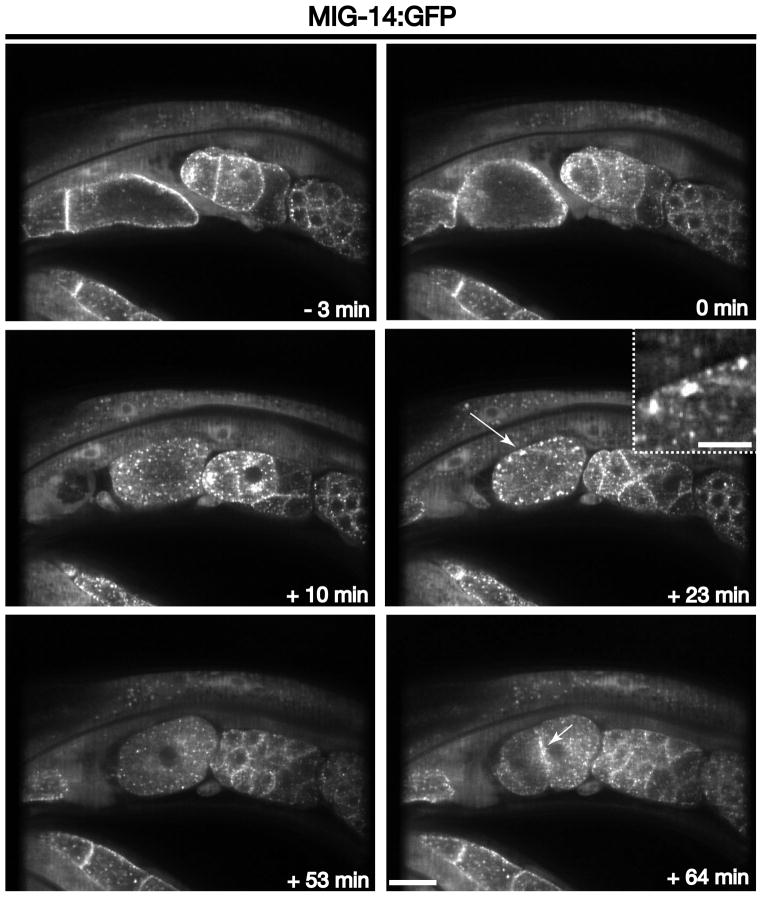
Figure 8. MIG-14 trafficking during the oocyte-to-embryo transition.
Images of MIG-14:GFP highlight its changing distribution at various times relative to zygote ovulation. The long arrow highlights the accumulation of MIG-14 in peripherally distributed, enlarged endosomes that form during the second wave of clathrin-mediated endocytosis (+23 min timepoint). The short arrow highlights the secretion of MIG-14 back to the plasma membrane following the first embryonic cytokinesis (+64 min timepoint). Inset is a 3.5x zoomed view of the area highlighted by an arrow. Scale bar, 20 μm. Inset scale bar, 5 μm.

