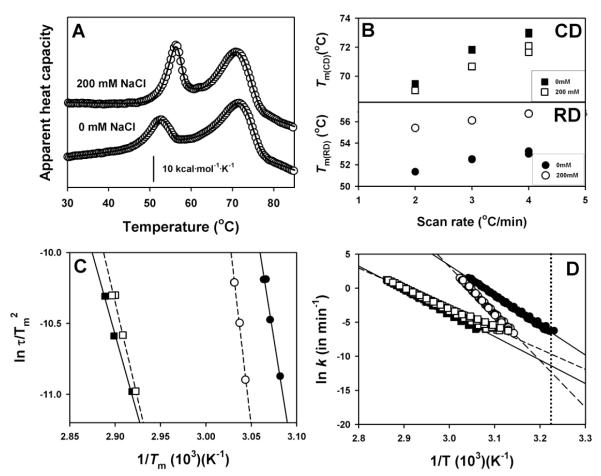
Figure 3. Thermal stability and denaturation mechanism of hCBS in the absence and presence of 200 mM NaCl.
A) DSC profiles at 3°C/min. B) Scan rate dependence of Tm values of RDs (lower panel) and CDs (lower panel). C) Consistency test for the two-state kinetic model based on the Tm dependence on scan rates [44]. D) Arrhenius plots for the denaturation of RDs and CDs in the absence/presence of 200 mM salt. The dotted vertical line indicates 37°C. In panel B, errors are smaller than data points. For the rest, data are from a single experiment at different scan rates.

