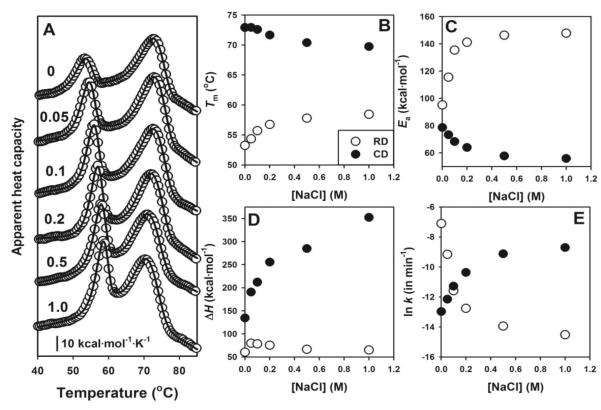
Figure 4. Dependence of thermal denaturation of hCBS on salt concentration.
A) Thermal denaturation profiles at the indicated NaCl concentrations (in mol/L); B-E) Salt concentration dependence of thermal denaturation parameters (Tm, Ea, ΔH and ln k) on salt concentrations for RDs (open circles) and CDs (closed circles). Experiments performed at 4°C/min. All data are from single DSC experiments. In panels B to D, fitting errors are smaller than the symbols.

