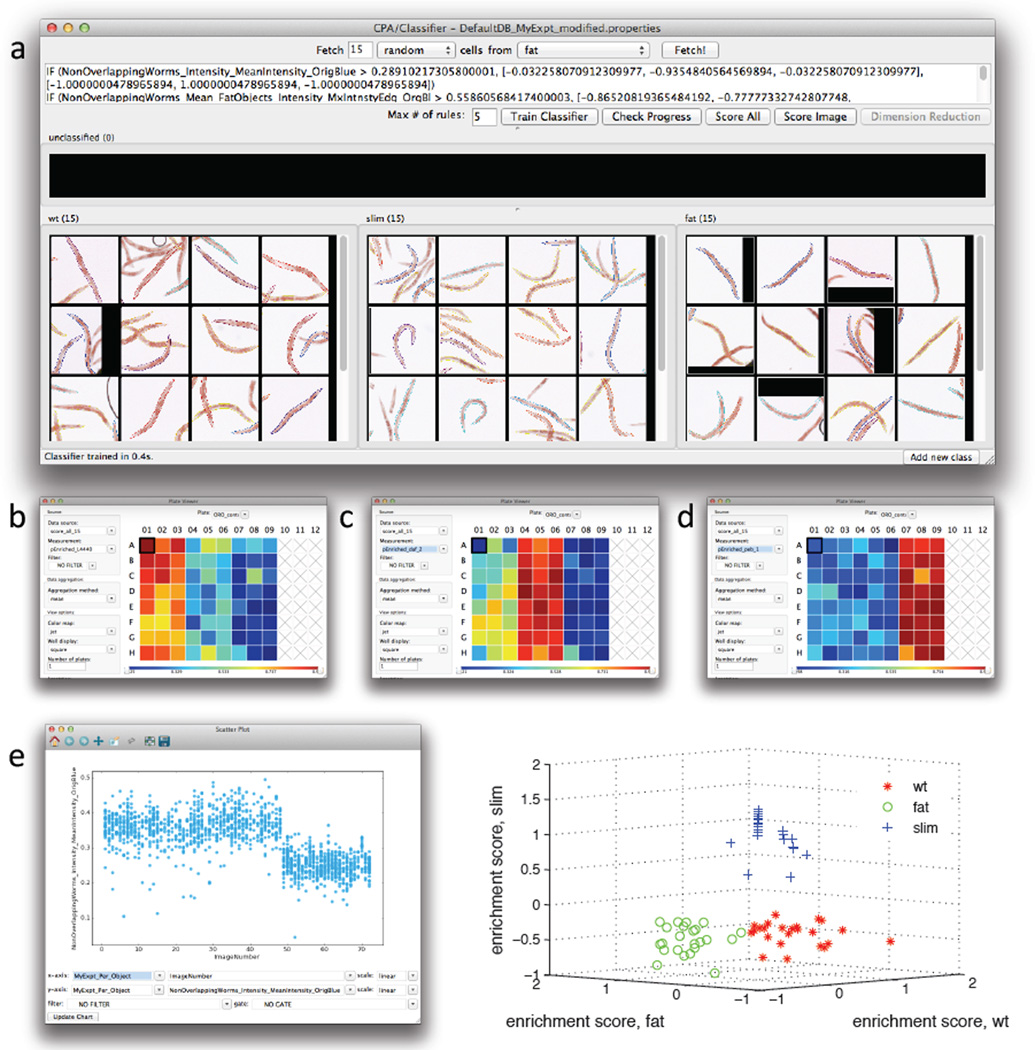
Figure 3.
Use of the machine learning capabilities of CellProfiler Analyst to classify worms as having a wild-type, fat, or slim phenotype. Twenty-four wells (columns 1–3) contained vector-control treated worms (wild type), 24 wells (columns 4–6) contained daf-2 RNAi treated worms (fat), and 24 wells (columns 7–9) contained peb-1 RNAi treated worms. a) Fifteen training individual worms were randomly selected among the wells from each of the three RNAi treatments, and used for training the classifier. After training, the classifier was applied to the full dataset (consisting of 1527 worms). Enrichment scores were then calculated and displayed as a plate layout heatmap in CellProfiler Analyst for each of the phenotypes b) wild-type worm enrichment, c) fat worm enrichment, and d) slim worm enrichment. As can be seen, the three well columns containing each of these controls scores highest (yellow/red) for the expected phenotype whereas the remaining columns show lower scores (blue). e) The most significant classification rule, or feature measurement, identified by CellProfiler Analyst (shown in the top window of a), was the mean intensity of all pixels within a worm in the blue image channel. If this per-worm measure is scatter-plotted versus image number (the sequential order of images in the experiment, left to right across the plate), it is clear that this measurement is significantly lower for peb-1 (the right-hand third of the data points) as compared to daf-2 and L4440 (the left-hand two-thirds of the data points) but it is not sufficient to separate all three phenotypes. This indicates that more than a single measurement is necessary to separate all three phenotypes from each other and thus that the machine-learning Classifier step is necessary. Indeed, a 3D scatterplot of per-well enrichment scores from the machine-learning Classifier step (f) clearly shows that the three phenotypes can be separated if a combination of differentiating parameters is used instead of a single measurement.

