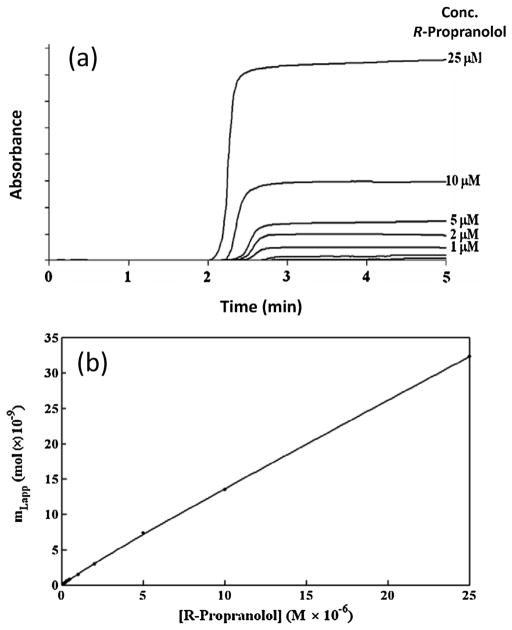
Fig. 7.
(a) Typical chromatograms (i.e., breakthrough curves) obtained for a frontal analysis experiment, as obtained here for the application of various solutions R-propranolol to a 5 cm × 2.1 mm i.d. column containing immobilized high-density lipoprotein (HDL). (b) Analysis of frontal analysis data obtained for R-propranolol on the HDL column by fitting to the results to a model based on a combination of a saturable binding site and a non-saturable interaction. Reproduced with permission from Ref. [117].

