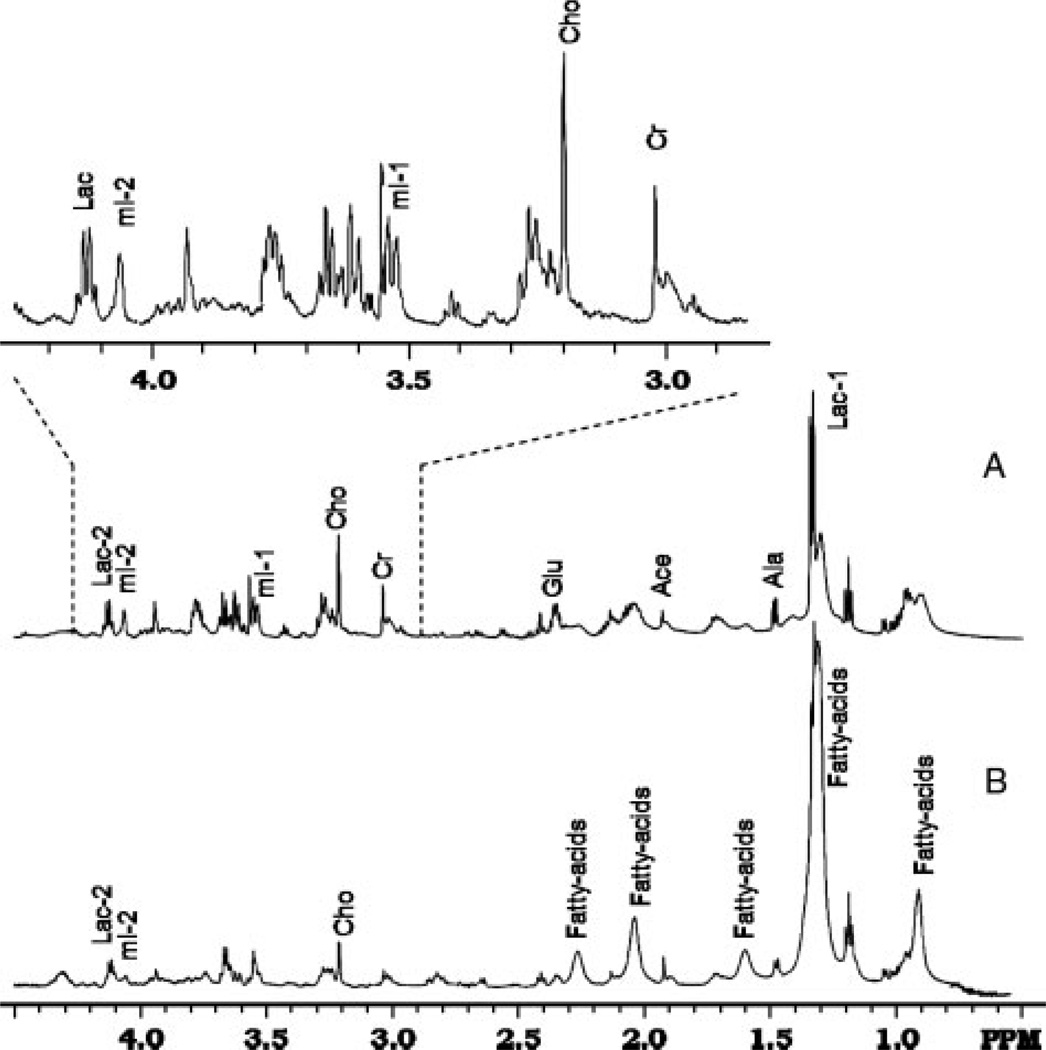
Figure 2.
1D HRMAS NMR spectra of original MSCs (A) and cells differentiated from MSCs (B). MSCs had undergone differentiation for 3 weeks at the time of recording spectrum B, which represents a mix of end-point fat cells and remaining undifferentiated MSCs. An expanded spectrum from the region of 2.8–4.3 ppm of the spectrum from MSCs (A) is inserted

