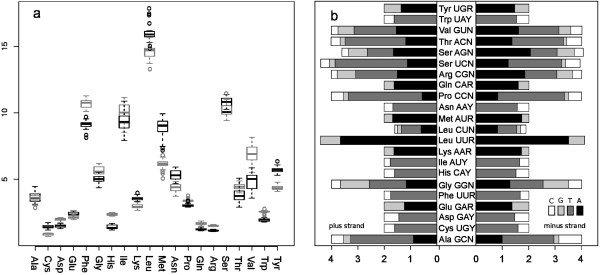
Figure 3.

Metacrangonyctidae mitochondrial protein-coding gene amino acid composition. (a) Box plot showing amino acid composition for PCGs across mitogenomes. Grey and black boxes display values estimated for genes coded on the (+) and (-) strands, respectively. (b) Relative Synonymous Codon Usage (RSCU) for genes coded on (+) and (-) strands.
