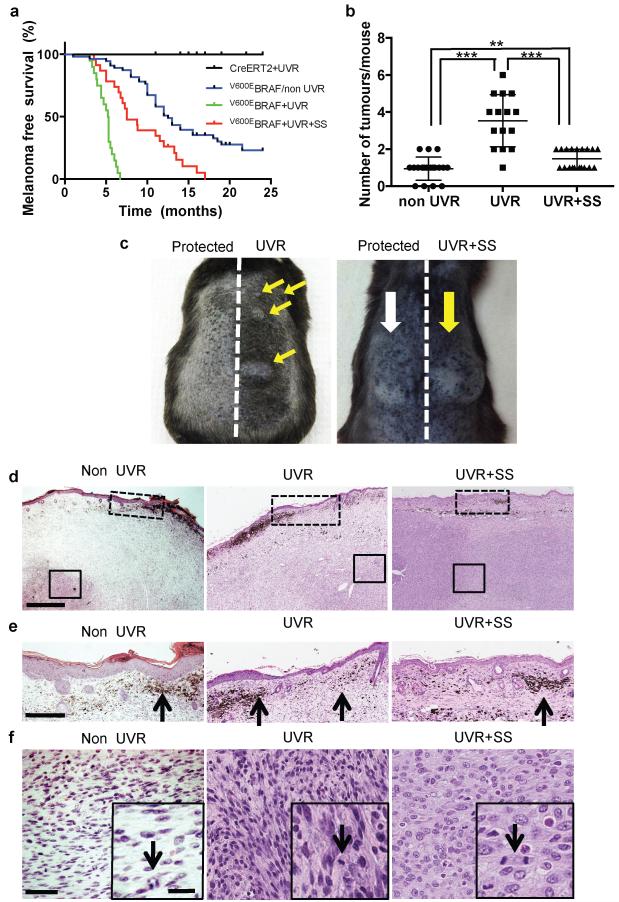
Figure 2. UVR accelerates BRAFV600-driven melanomagenesis.
a. Kaplan-Meier showing melanoma-free survival in tamoxifen-treated UVR-exposed CreERT2 mice (CreERT2+UVR; n=14); V600EBRAF mice (V600EBRAF/non UVR; n=55); UVR-exposed V600EBRAF mice (V600EBRAF+UVR; n=19) and UVR-exposed sunscreen-protected V600EBRAF mice (V600EBRAF+UVR+SS; n=22). V600EBRAF/non-UVR vs.V600EBRAF+UVR, p <0.0001;V600EBRAF+UVR vs. V600EBRAF+UVR+SS, p <0.0001; V600EBRAF/non-UVR vs. V600EBRAF+UVR+SS, p= 0.0003; Log-rank Test. All tests are 2-sided. b. Median tumour numbers in V600EBRAF/non-UVR (non-UVR), V600EBRAF+UVR (UVR) and V600EBRAF+UVR+SS (UVR+SS) mice. The error bars show mean ± SD. *** p-<0.0001; ** p-<0.008 Wilcoxon Signed-Rank Test (WSRT). c. Photograph of UVR mouse 5.3 months after UVR and UVR+SS mouse 6.5 months after UVR. Yellow arrows: UVR tumours; white arrow: protected tumours. d. H&E from non-UVR, UVR and UVR+SS mice. Bar: 0.5mm. e. Dashed-boxes from Fig 2d. Black arrows: dermal naevi. Bar: 250μm. f. Solid-boxes from Fig 2d; scale bar 50μm. Inset: black arrows: mitotic cells. Bar: 10μm.

