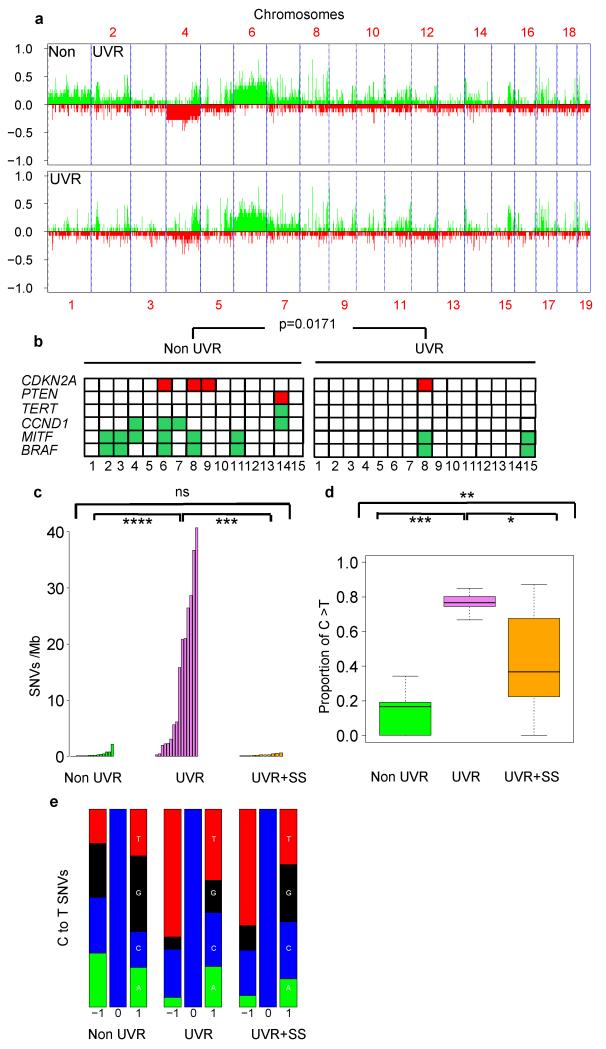
Figure 3. Genome analysis of UVR-driven melanomas.
a. Somatic copy number alterations by aCGH in non-UVR and UVR tumours. b. Melanoma oncogene and tumour suppressor gene gains (green) and losses (red) by aCGH in non-UVR and UVR tumours. p=0.0171; WRST. c. Somatic SNVs/Mb in non-UVR (green), UVR (violet) and UVR+SS (orange) tumours; ****: p=1.79e-06; ***: p=1.165e-05; ns: not significant p=0.6461; WRST. d. Proportion of C>T (G>A) transitions at 3′ end of pyrimidine dimers in non-UVR, UVR and UVR+SS tumours. The error bars show the lowest data still within 1.5 IQR of the lowest quartile and highest data within 1.5 IQR of the upper quartile. *** p<0.0001, ** p=0.007698, * p= 0.02558; WRST. e. Proportion of each nucleotide (A: green, C: blue, G: black, T: red) ±1bp of all C to T (G to A) transitions in non-UVR, UVR and UVR+SS tumours.

