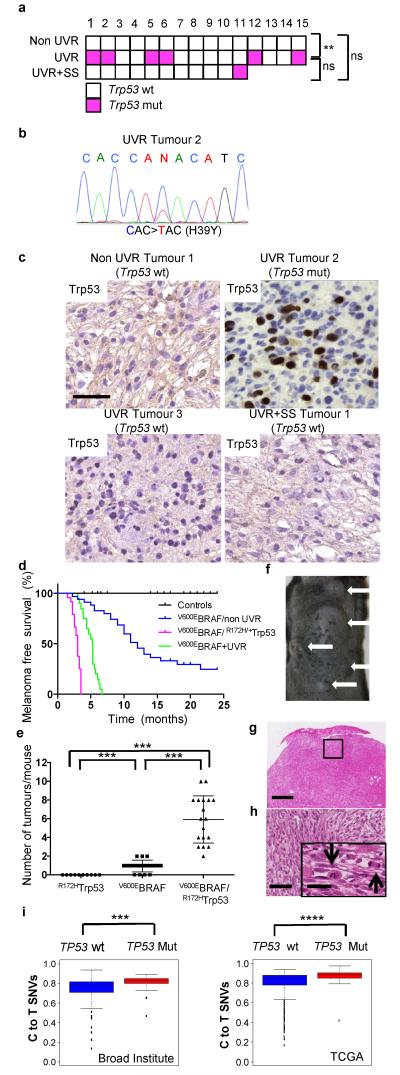
Figure 4. Mutant Trp53 accelerates V600EBRAF-driven melanomagenesis.
a. Trp53 mutations (wt: wild-type, white; mut: mutant, magenta) in non-UVR, UVR and UVR+SS tumours; ** p=0.017; Fisher Exact Test. b. Sanger sequencing confirming C>T, p.H39Y Trp53 mutation in UVR tumour 2. c. Trp53 immunostaining in non-UVR Tumour 1 (Trp53 wt), UVR Tumour 2 (Trp53 mut), UVR Tumour 3 (Trp53 wt), and UVR +SS Tumour 1 (Trp53 wt). Bar 50μm. d. Kaplan-Meier showing melanoma free survival in tamoxifen-treated CreERT2 and CreERT2/R172HTrp53 (control; n=42), V600EBRAF/non-UVR (n=35), V600EBRAF/R172HTrp53 (n=23) and V600EBRAF+UVR (n=19) mice. V600EBRAF/non-UVR vs. V600E BRAF/R172HTrp53, p<0.0001; V600EBRAF+UVR vs. V600EBRAF/R172HTrp53, p<0.0001; Log-rank Test. e. Median tumour numbers in tamoxifen-treated CreERT2/R172HTrp53 mice (R172HTrp53), V600EBRAF/non-UVR (V600EBRAF) and V600EBRAF/R172HTrp53 mice. The error bars show mean ± SD. ***p<0.0001, WRST. f. V600EBRAF/R172HTrp53 mouse with multiple tumours (white arrows). g. H&E from a V600EBRAF/R172HTrp53 tumour. Bar 0.5mm. h. Boxed area from Fig. 4g. Bar: 250μm. Inset black arrows: mitotic cells. Bar: 5μm. i. Proportion of C>T (G>A) transitions in TP53 wild-type (wt) or mutant (mut) human melanomas from the Broad Institute18 (***p=0.002, WRST) and TCGA (https://tcga-data.nci.nih.gov/tcga/; ****p=1.79E-05) datasets. The error bars show the lowest data still within 1.5 IQR of the lowest quartile and highest data within 1.5 IQR of the upper quartile.

