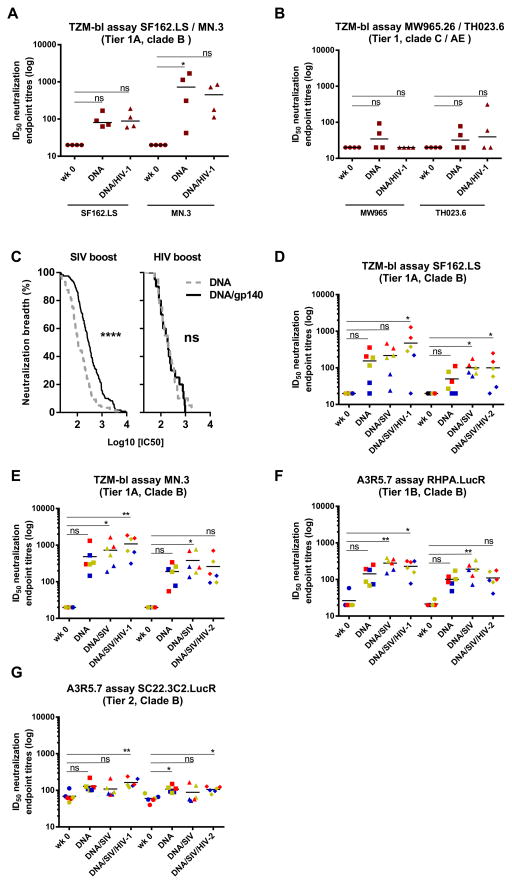
FIGURE 4. SIVmac239 can boost HIV-1 neutralization better than HIV-1 clade A ITM-1_4 while HIV-1 NIBSC40-9 clade A can support SIVmac239 responses.
(A, B). A comparative arm that received DNA clade B priming followed by the HIV-1 clade A ITM-1_4 gp140 boost (Gr.5), was tested against SF162.LS, MN.3, MW965 and TH023.6 with ID50 titres displayed in brown. (C) Magnitude-Breadth curves show pooled data from both TZM-bl and A3R5.7 assays for the viruses that were tested on all animals (HIV-1 clade B isolates MN.3, SF162.LS, 9020.A13.LucR., RHPA.LucR., SC22.3C2.LucR.). Data obtained after DNA prime and after one protein boost are shown for sera from groups 1 and 2 (left panel) as well as the HIV-1 comparative arm (group5) (right panel). A Mantel-Cox log-rank test was used for statistical comparison. **** p<0.0001; ns= not significant. (D–G) Sera were collected in another comparative study before immunization (wk 0), 4 weeks after last DNA immunization (DNA), 4 weeks after first SIVmac239gp140 boost (DNA/SIV) and 2 weeks after the second gp140 protein boost ((DNA/SIV/HIV-1) or (DNA/SIV/HIV-2)). An arbitrary color code indicate the animals with the highest titres against SF162.LS in red (n=2), lowest in blue (n=2) and those in between in yellow (n=2). These colors are kept throughout the figure to be able to track the animals and their respective response to other viruses. Significant values are indicated by *** p<0.001, **p<0.01 and *p<0.05 as well as non-significant (ns) using One-Way ANOVA, Friedman’s test with Dunns’s Multiple Comparison Test.

