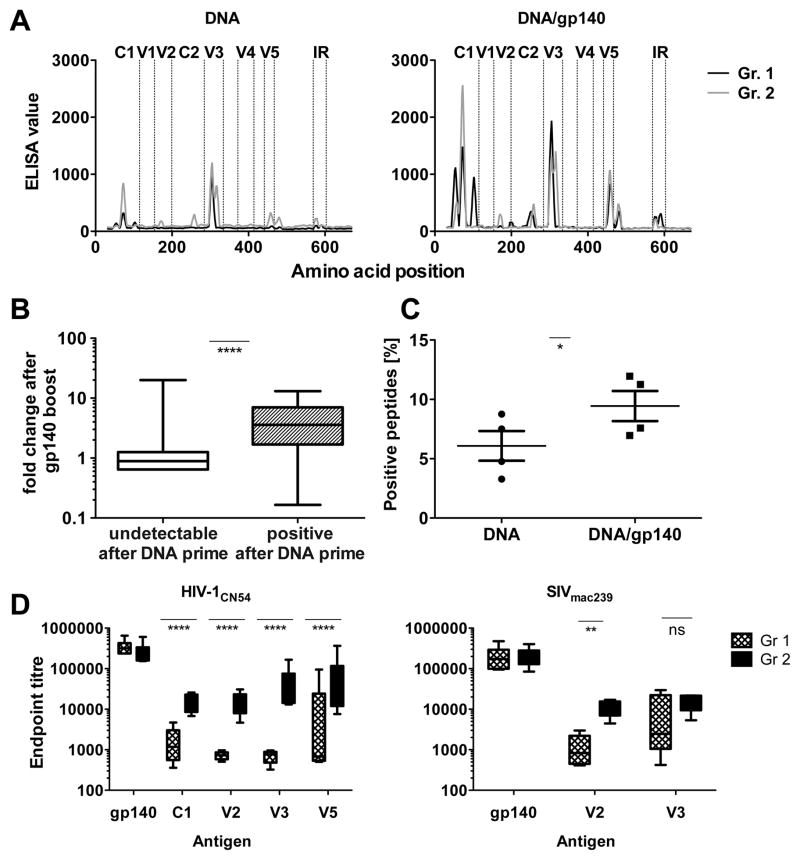
FIGURE 5. Epitope mapping reveals preferential binding to C1, C2, V2, V3 and V5.
(A) Selected sera (n=2 per group from the first study) from time points after HIV-1 DNA-prime (wk 16, DNA) and after the first SIVmac239 protein boost (wk 20, DNA/gp140) were subjected to epitope mapping by pepscan peptide arrays using heterologous HIV-1CN54 peptides. (B) The change in response intensity after SIVmac239 protein boosting is shown for peptides that were undetectable after DNA immunizations (white) or showed positive responses after DNA priming (grey) (C) Percentage of positive peptides detected before (wk 16, DNA) and after the boost (wk20, DNA/gp140) in the peptide array. (D) ELISA binding titres to indicated peptides from HIV-1 or SIVmac239 were determined after the second protein boost (wk 22) in animals immunized without (Gr. 1; n=6) or with a cellular adjuvant AAC during the priming phase (Gr. 2; n=6) (mean+SEM). Significant values are indicated by *p<0.05, **p<0.01 and ****p<0.0001 as well as ns=not significant using a Mann-Whitney test (B), a paired t test (C), or a one-way ANOVA of log-transformed data with a Bonferroni’s Multiple Comparison Test (D).

