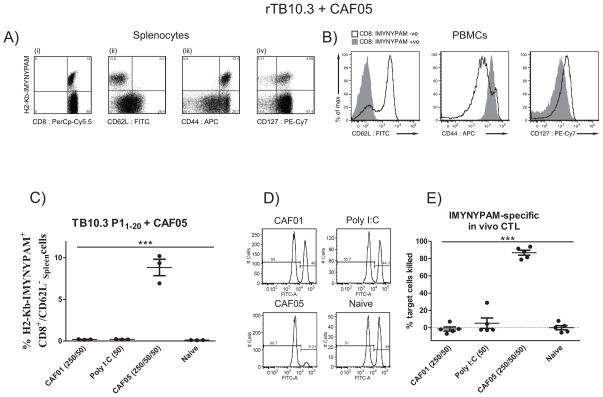
Figure 4. Vaccine-promoted TB10.3/43-11-specific CD8+ T cells are in activated state, express memory precursor marker and exhibit high in vivo cytotoxicity.
(A, B) Mice (C57BL/6; n = 3) were immunized three times two weeks apart with 5 μg rTB10.3 + CAF05 i.p.
(A) Unstimulated spleen cells (pooled) were stained using PE-conjugated MHC class I dextramer H2-Kb-IMYNYPAM and surface markers against (i) CD8, (ii), CD62L, (iii) CD44 and (iv) CD127 (IL-7 receptor). Cells were gated as follows: singlets > lymphocytes > CD4+ vs CD8+. Histograms are representative of two independent experiments with similar results.
(B) Pooled PBMCs were isolated after the last immunization and subjected to MHC class I dextramer staining using PE-conjugated MHC class I dextramer H2-Kb-IMYNYPAM. IMYNYPAM+ cells were gated and histogram overlays relative to IMYNYPAM+ CD8+ T cells are shown, from one of two representative experiments.
(C–E) Groups of mice (C57BL/6; n = 8/group) were immunized twice using 5 μg TB10.3 P11-20 + either CAF01 (DDA/TDB – 250/50 μg/dose), Poly I:C in PBS (50 μg/dose), or CAF05 (DDA/TDB/Poly I:C – 250/50/50 μg/dose), or left non- immunized.
(C) Nine days post-immunization, individual splenocytes (n = 3) were MHC class I dextramer-stained using PE-conjugated H2-Kb-IMYNYPAM and gated as in Fig. 2A. The frequency of IMYNYPAM+CD8+CD62L− cells from CD8+ T cells is shown. Each symbol represents an individual mouse and means ± SEM are shown. *** p < 0.001 (One-way ANOVA, Tukey’s post-test).
(D) In vivo CTL assay. Ten days after immunization, splenocytes from naïve feeder mice were isolated and either pulsed with the 9-mer CD8 epitope TB10.3/4 P13-11 and stained with a high concentration of CFSE or left unpulsed and stained with a tenfold lower CFSE concentration. These CFSEhigh and CFSElow cells were mixed at a 1:1 ratio and adoptively transferred i.v. into remaining mice from each immunization group (n = 5). One day after transfer, the cytotoxicity was determined by comparing the ratio of pulsed (CFSEhigh) to unpulsed (CFSElow) cells. Cells were gated as follows: singlets > SSC vs CFSE > CFSE+. Histogram plots (# of cells vs CFSE) from blood (RBC lysed; pooled) of each immunization group are shown.
(E) In vivo CTL activity was determined in spleens and expressed as specific lysis. Each symbol represents an individual mouse (n = 5/group, experiment was repeated two times with similar results). Means ± SEM shown. *** p < 0.001, (One-way ANOVA, Tukey’s post-test).

