
Figure 1. LT-treated SD rats develop diastolic dysfunction.
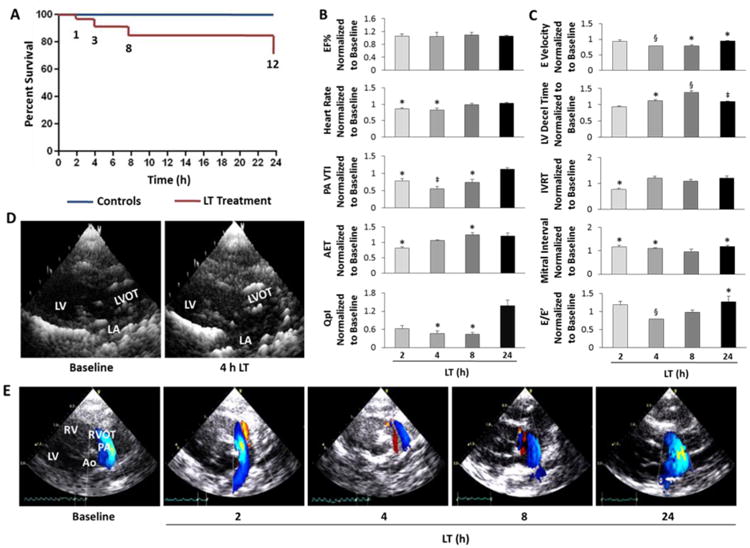
A, Kaplan-Meier survival curve for controls and LT-treated SD rats. B, Cardiac indices of systolic function, including percent ejection fraction (EF%), blood flow through the pulmonary artery (PA) measured as the PA velocity time integral (VTI), aortic ejection time (AET), and cardiac output normalized to body weight (QpI). C, Cardiac indices of diastolic function, including early (E) LV diastolic filling velocities, LV deceleration (decel) time, and isovolumic relaxation time (IVRT) of LT-treated SD rats normalized to individual baseline values for each rat. E/E′ indicates early diastolic filling velocities measured by continuous wave Doppler divided as a ratio to the tissue Doppler E velocity. D, Representative parasternal long-axis views of the left atrium (LA), LV outflow tract (LVOT) and LV at baseline and 4 h post-LT. 2-D images were rendered as 3-D images using Gwyddion software. E, Representative color flow Doppler images of pulmonary artery blood flow during the time-course of LT toxicity. Red indicates blood flow towards the probe and blue indicates blood flow away from probe. All values are reported as mean ± SEM. n = 6-10 rats per group. Statistical significance is depicted as *P<0.05, ‡P<0.01 and §P<0.001 by paired t-test to individual baseline values for each animal.