
Figure 2. MAPK, Akt and Ca2+ihandling signaling proteins are dysregulated in LV tissue of LT-treated SD rats.
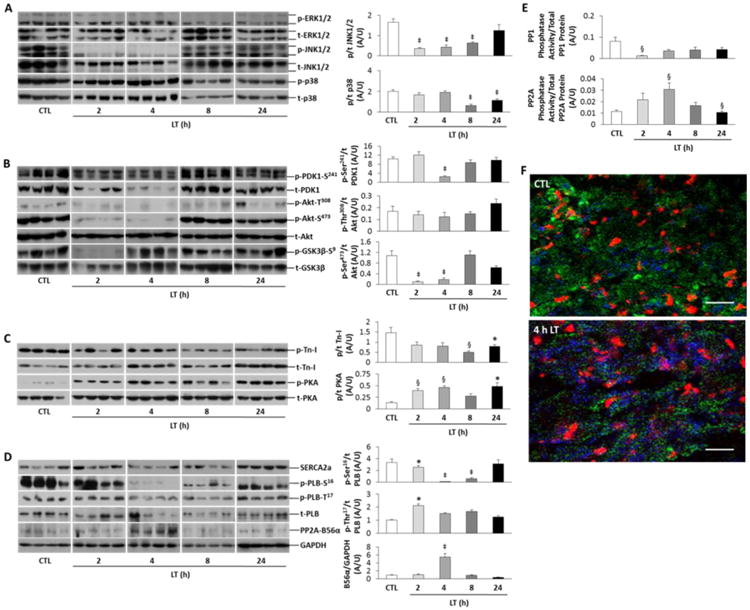
A, Representative immunoblots of phosphorylated (p) and total (t) ERK, JNK and p38 MAPK. Densitometry of p/t is shown at right for JNK and p38. B, Immunoblots for PDK1, Akt phosphorylation at Thr308 and Ser473 and GSK3β. Densitometry at right shows p/t for PDK1 and Akt. C, Immunoblots and densitometry (p/t) for troponin-I (Tn-I) and PKA. D, Immunoblots of phospholamban (PLB, p-Ser16 and p-Thr17), SERCA2a, PP2A-B56α and GAPDH total protein. Densitometry shows p/t for B56α/GAPDH and PLB (p-Ser16 and p-Thr17/t). E, PP1 and PP2A specific phosphatase activities are represented as a ratio of PP1 or PP2A enzymatic activity to total PP1 or PP2Ac (PP2A catalytic subunit) protein. F, Representative confocal microscopic images (60×, oil) of frozen LV tissue sections from a control and 4 h LT-treated rat showing immunofluorescence of Tn-I (green), propidium iodide (red)staining and PP2A activity (Di-FMU fluorescence, blue). Scale bar is 200 μm. All values are reported as mean ± SEM. For all analyses, n = 6-10 rats per group. Statistical analysis: *P<0.05, ‡P<0.01 and §P<0.001 versus Controls in one-way ANOVA.