
Figure 3. Characterization of temporal signaling and Ca2+ihandling effects of LT in isolated CMs.
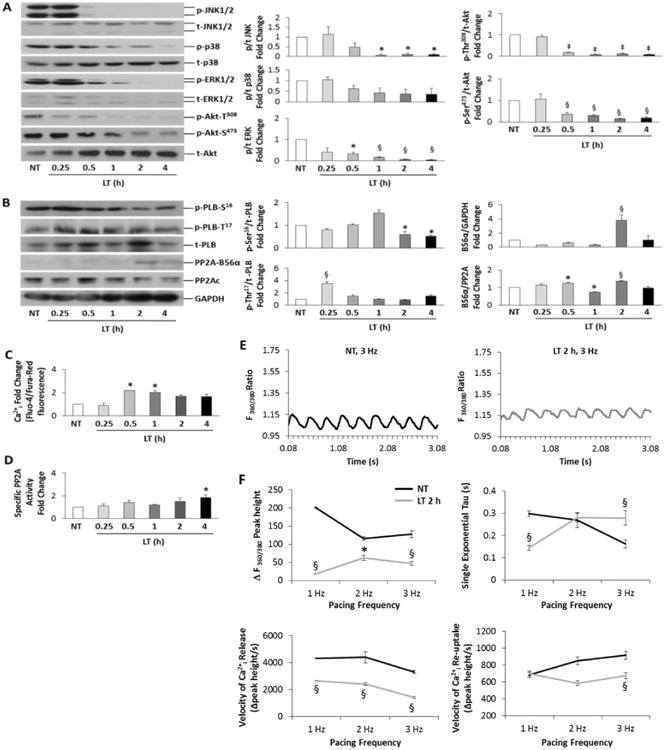
A, Western blot analysis (left) of MAPKs and Akt phosphorylation (p) and total (t) protein during timecourse of LT (0.05 ng/mL PA + 0.025 ng/mL LF) toxicity. Densitometry (p/t) fold change is shown at right. B, Immunoblotting (left) of PLB, PP2Ac (catalytic subunit) and PP2A-B56α. Densitometry (p/t) fold change is shown at right. GAPDH was used as a loading control. C, Ratiometric Ca2+I determination by Fluo-4/Fura-Red fluorescence, normalized to control (dye only). D, Specific PP2A activity fold change represented as PP2A enzymatic activity/PP2Ac total protein. n = 6-8 per group Densitometry and phosphatase enzymatic data were analyzed by one-way ANOVA; *P<0.05, ‡P<0.01 and §P<0.001 versus Controls. All values are reported as mean ± SEM. E, Representative Ca2+ transients monitored by Fura-2 ratiometic (360/380 nm) fluorescence imaging for CMs field-stimulated at 3.0 Hz; control (NT, non-treated) CMs (top) versus CMs treated with LT for 2 h (bottom). F, Group data for Ca2+ transient peak height [ΔF(360/380)], tau, velocities of Ca2+ release and re-uptake for NT and LT-treated CMs field-stimulated at 1, 2 and 3 Hz. Data are averaged from n=5 dispersions, averaging 4 groups of CMs and 5-10 transients per group. *P<0.05 and §P<0.001 versus NT in Student's t-test.