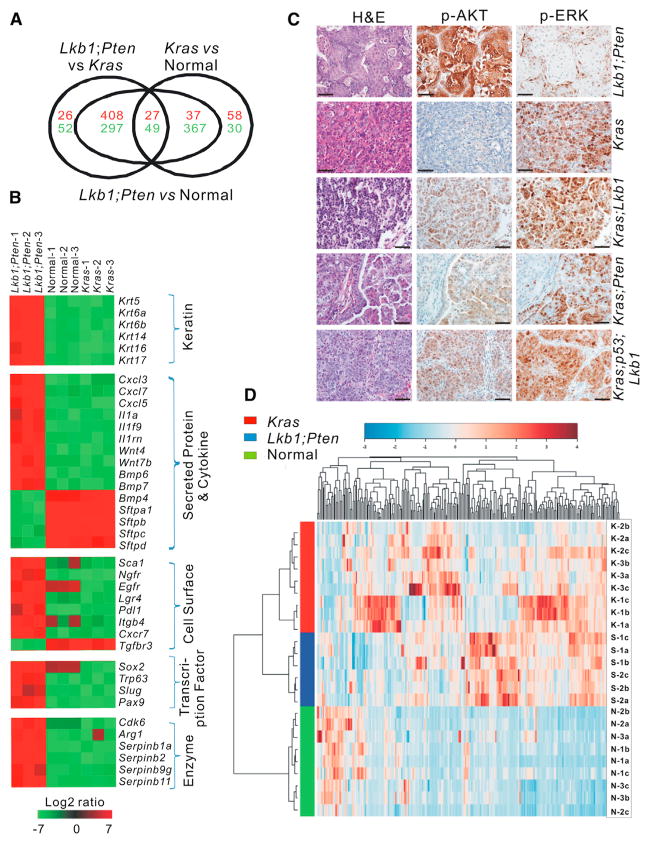
Figure 3. Lkb1fl/fl;Ptenfl/fl Lung SCCs Display Unique Gene Expression, Metabolism, and Downstream Signaling Pathways.
(A) EpCAM+CD31−CD45− cells were isolated by FACS and subject to microarray expression analysis. Euler diagram illustrating the gene expression profiles of epithelial cells from LP SCCs, Kras ADCs, and normal lung tissues.
(B) Heatmap depicting differential expression of selected genes in LP SCCs, Kras ADCs, and normal lung tissues as determined by microarray expression profiling. Red indicates upregulation. and green indicates downregulation.
(C) Immunohistochemical staining for p-AKT and p-ERK on LP, Kras, Kras;Lkb1, Kras;Pten, and Kras;p53;Lkb1 tumor nodules. Scale bars represent 50 μm for all panels.
(D) Hierarchical clustering by Ward method of quantitative metabolomic profiling for LP SCC tumors (S), Kras ADC tumors (K), and normal lung tissues (N).
See also Figure S3 and Tables S1 and S2.

