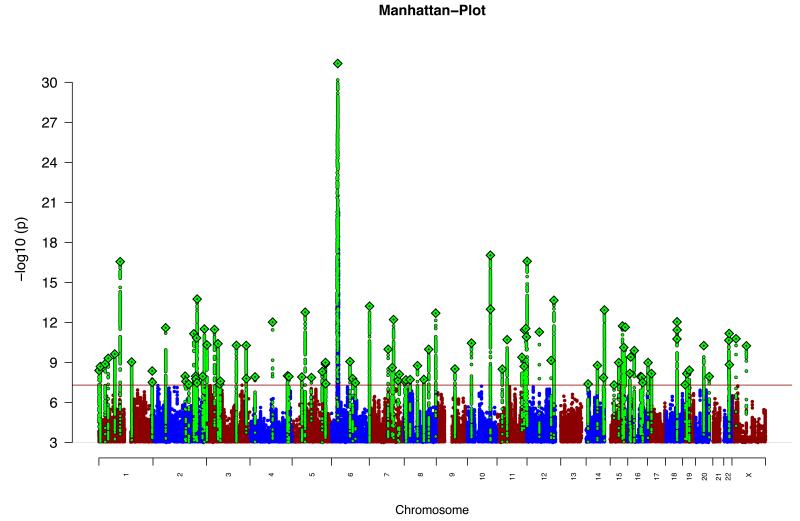
Figure 1. Manhattan plot.
Manhattan plot of the discovery genome-wide association meta-analysis of 49 case control samples (34,241 cases and 45,604 controls) and 3 family based association studies (1,235 parent affected-offspring trios). The x-axis is chromosomal position and the y-axis is the significance of association (−log10(P)).The red line shows the genome-wide significance level (5×10⁻⁸). SNPs in green are in LD with the index SNPs (diamonds) which represent independent genome-wide significant associations.

