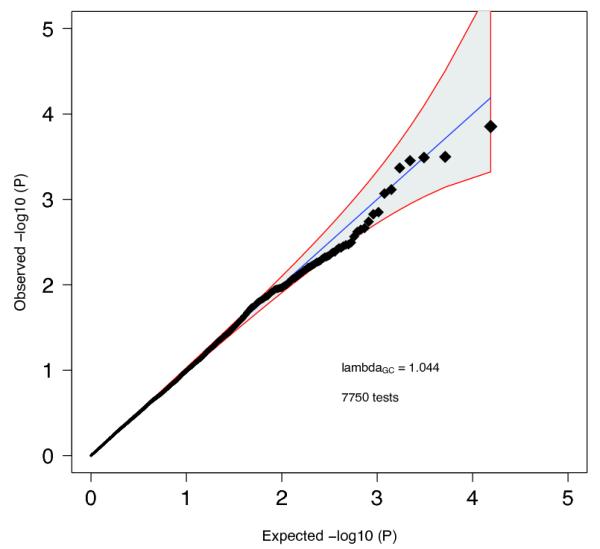
Quantile-quantile plot for all pair-wise (N=7750) combinations of the 125 independent autosomal genome-wide significant SNPs tested for non-additive effects on risk using case-control datasets of European ancestry (32,405 cases and 42,221 controls). We included as covariates the principal components from the main analysis as well as a study indicator. The interaction model is described by:
X1 and
X2 are genotypes at the two loci,
X1*
X2 is the interaction between the two genotypes modeled in a multiplicative fashion,
X4 is the vector of principal components,
X5 is the vector of study indicator variables. Each
β is the regression coefficient in the generalized linear model using logistic regression. The overall distribution of
P-values did not deviate from the null and the smallest
P-value (4.28×10
−4) did not surpass the Bonferroni correction threshold (p=0.05/7750= 6.45×10
−6). The line x=y indicates the expected null distribution with the grey area bounded by red lines indicating the expected 95% confidence interval for the null.

