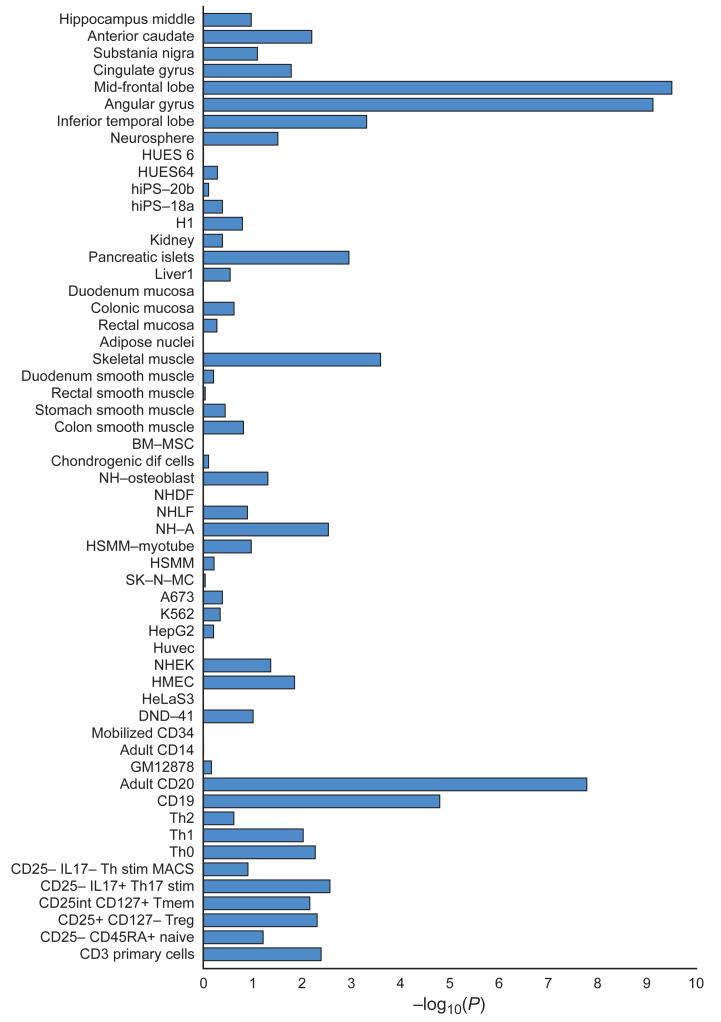
Figure 2. Enrichment in enhancers.
Cell and tissue type specific enhancers were identified using ChIP-seq datasets (H3K27ac signal) from 56 cell line and tissue samples (Y-axis). We defined cell and tissue type enhancers as the top 10% of enhancers with the highest ratio of reads in that cell or tissue type divided by the total number of reads. Enrichment of credible causal associated SNPs from the schizophrenia GWAS was compared with frequency matched sets of 1000 Genomes SNPs (Supplementary Text). The X-axis is the −log10(P) for enrichment. P-values are uncorrected for the number of tissues/cells tested. A −log10(P) of roughly 3 can be considered significant after Bonferroni correction. Descriptions of cell and tissue types at the Roadmap Epigenome website (http://www.roadmapepigenomics.org).

