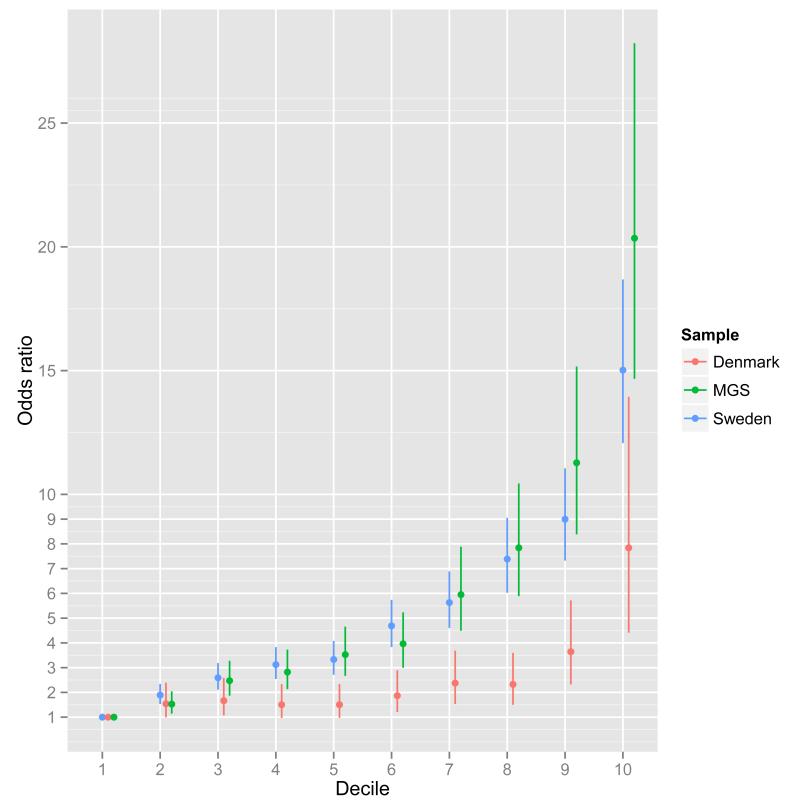
Figure 3. Odds ratio by risk score profile.
Odds ratio for schizophrenia by risk score profile (RPS) decile in the Sweden (Sw1-6), Denmark (Aarhus), and Molecular Genetics of Schizophrenia studies (Supplementary text). Risk alleles and weights were derived from ‘leave one out’ analyses in which those samples were excluded from the GWAS meta-analysis (Supplementary text). The threshold for selecting risk alleles was PT < 0.05. The RPS were converted to deciles (1=lowest, 10=highest RPS), and nine dummy variables created to contrast deciles 2-10 to decile 1 as the reference. Odds ratios and 95% confidence intervals (bars) were estimated using logistic regression with PCs to control for population stratification.

