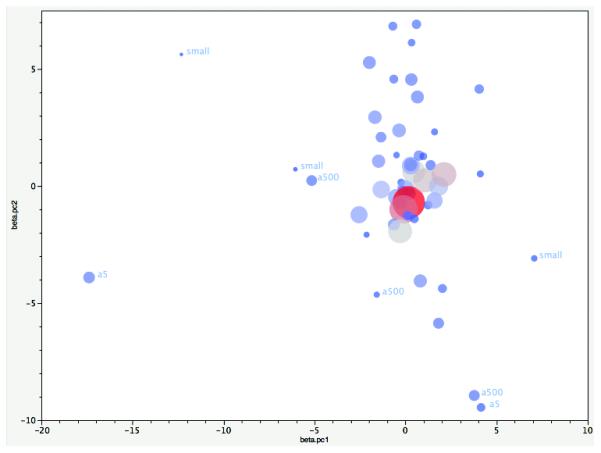
Extended Data Figure 1. Homogeneity of Effects Across Studies.

Plot of the first two principal components (PC) from principal components analysis (PCA) of the logistic regression β coefficients for autosomal genome-wide significant associations. The input data were the β coefficients from 52 samples for 112 independent SNP associations (excluding 3 chrX SNPs and 13 SNPs with missing values in Asian samples). PCAs were weighted by the number of cases. Each circle shows the location of a study on PC1 and PC2. Circle size and colour are proportional to the number of cases in each sample (larger and redder circles correspond to more cases). Most samples cluster. Outliers had either small numbers of cases (“small”) or were genotyped on older arrays. Abbreviations. a500 (Affymetrix 500K); a5 (Affymetrix 5.0). Studies that did not use conventional research interviews are in the central cluster (CLOZUK, Sweden, and Denmark-Aarhus studies).
