
Extended Data Figure 2. Quantile-quantile plot.
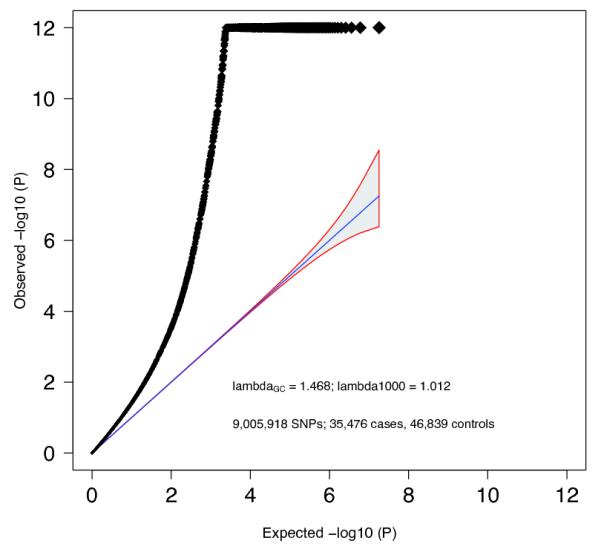
Quantile-quantile plot of GWAS meta-analysis. Expected −log10(P) -values are those expected under the null hypothesis. For clarity, we avoided expansion of the Y-axis by setting association P-values < 10−12 to 10−12. The shaded area surrounded by a red line indicates the 95% confidence interval under the null. Lambda is the observed median χ2 test statistic divided by the median expected χ2 test statistic under the null.