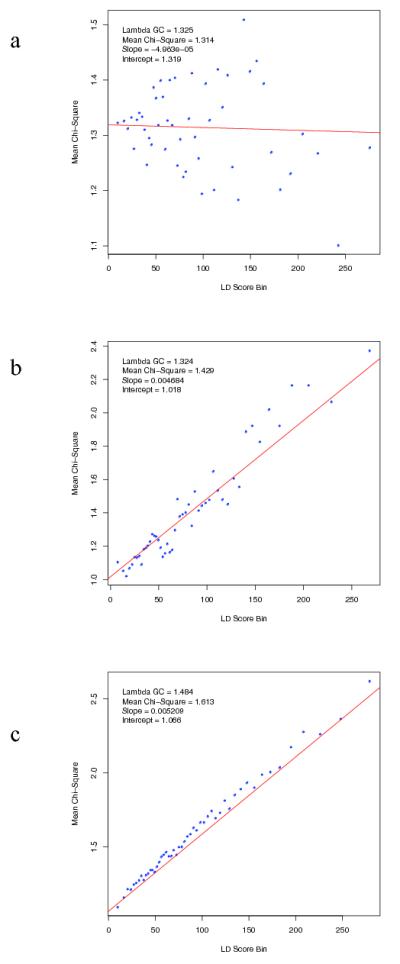
Extended Data Figure 3. LD Score regression consistent with polygenic inheritance.

The relationship between marker χ2 association statistics and linkage disequilibrium (LD) as measured by the LD Score. LD Score is the sum of the r2 values between a variant and all other known variants within a 1 cM window, and quantifies the amount of genetic variation tagged by that variant. Variants were grouped into 50 equal-sized bins based on LD Score rank. LD Score Bin and Mean χ2 denotes mean LD score and test statistic for markers each bin. We simulated (Supplementary Text) test statistics under two scenarios: (a) no true association, inflation due to population stratification (b) polygenic inheritance (λGC =1.32), in which we assigned independent and identically distributed per-normalized-genotype effects to a randomly selected subset of variants. Panel (c) present results from the PGC schizophrenia GWAS (λGC =1.48). The real data are strikingly similar to the simulated data summarized in (b) but not (a). The intercept estimates the inflation in the mean χ2 that results from confounding biases, such as cryptic relatedness or population stratification. Thus, the intercept of 1.066 for the schizophrenia GWAS suggests that ~90% of the inflation in the mean χ2 results from polygenic signal. The results of the simulations are also consistent with theoretical expectation (see Supplementary Text).
