
Extended Data Figure 5. MGS Risk Profile Score Analysis.
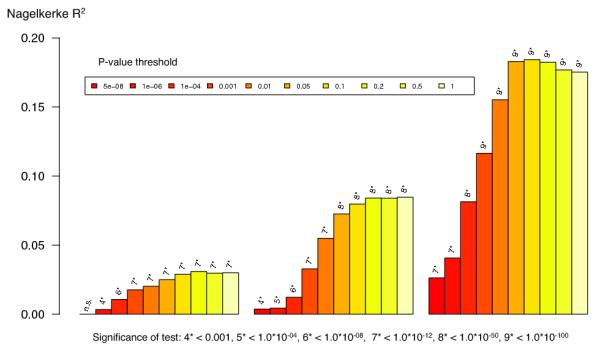
Polygenic risk profile score (RPS) analyses using the MGS18 sample as target, and deriving risk alleles from three published schizophrenia datasets (X-axis): ISC (2615 cases and 3338 controls) 10, PGC1 (excluding MGS, 9320 cases and 10,228 controls) 16, and the current meta analysis (excluding MGS) with 32,838 cases and 44,357 controls. Samples sizes differ slightly from original publication due to different analytical procedures. This shows the increasing RPS prediction with increasing training dataset size reflecting improved precision of estimates of the SNP effect sizes. The proportion of variance explained (Y-axis; Nagelkerke’s R2) was computed by comparison of a full model (covariates + RPS) score to a reduced model (covariates only). Ten different P-value thresholds (PT) for selecting risk alleles are denoted by the colour of each bar (legend above plot). For significance testing, see the bottom legend which denotes the P-value for the test that R2 is different from zero. All numerical data and methods used to generate these plots are available in Supplementary Tables 6, 7, and Supplementary Text.