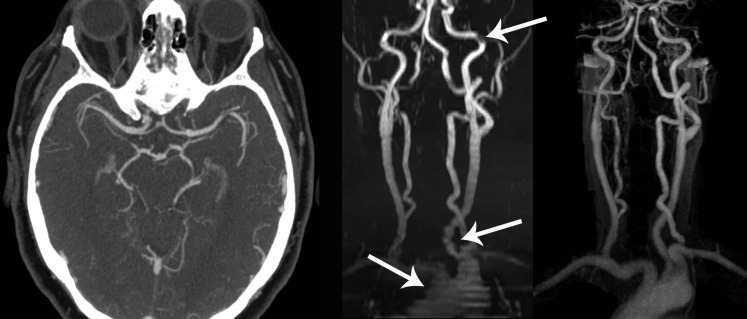
Figure 3.
CT and MR angiography. Left image shows normal CT angiography through the circle of Willis. Time-of-flight MR angiography (middle image) and contrast-enhanced MR angiography (right image) of the neck arteries are compared in the coronal plane. Note significant artefacts on time-of-flight images (arrows).

