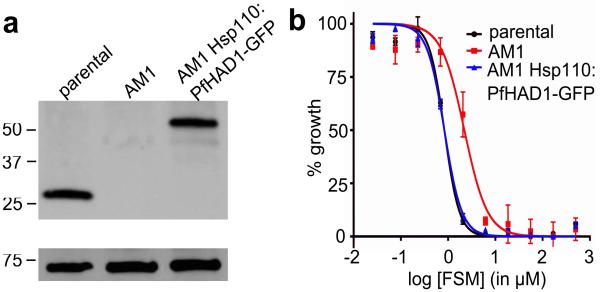
Figure 5. Loss of PfHAD1 is required for FSM resistance.
Data shown are representative of at least three independent experiments. (a) Immunoblot of the parent strain, FSMR strain AM1, and AM1 Hsp110:PfHAD1-GFP. Full blots are shown in Supplementary Fig. 3. Marker units are kilodaltons (kDa). Top panel was probed with anti-PfHAD1 antisera, and the bottom panel was probed with anti-heat shock protein 70 (hsp70) antisera as a loading control. Expected approximate protein masses: native PfHAD1, 33 kDa; PfHAD1-GFP, 60 kDa; hsp70, 74 kDa. (b) FSM IC50s of the parent strain, FSMR strain AM1, and AM1 Hsp110:PfHAD1-GFP. Displayed are the means ± standard error of the mean (SEM). The parent strain has a FSM IC50 of 1.1 ± 0.2 μM, while AM1 has an IC50 of 5.5 ± 1.5 μM. Expression of PfHAD1-GFP in AM1 results in an IC50 of 1.4 ± 0.2 μM. Data shown are mean is normalized such that 100% growth is defined by that of untreated cells, and 0% growth is defined as the smallest value in each data set.

