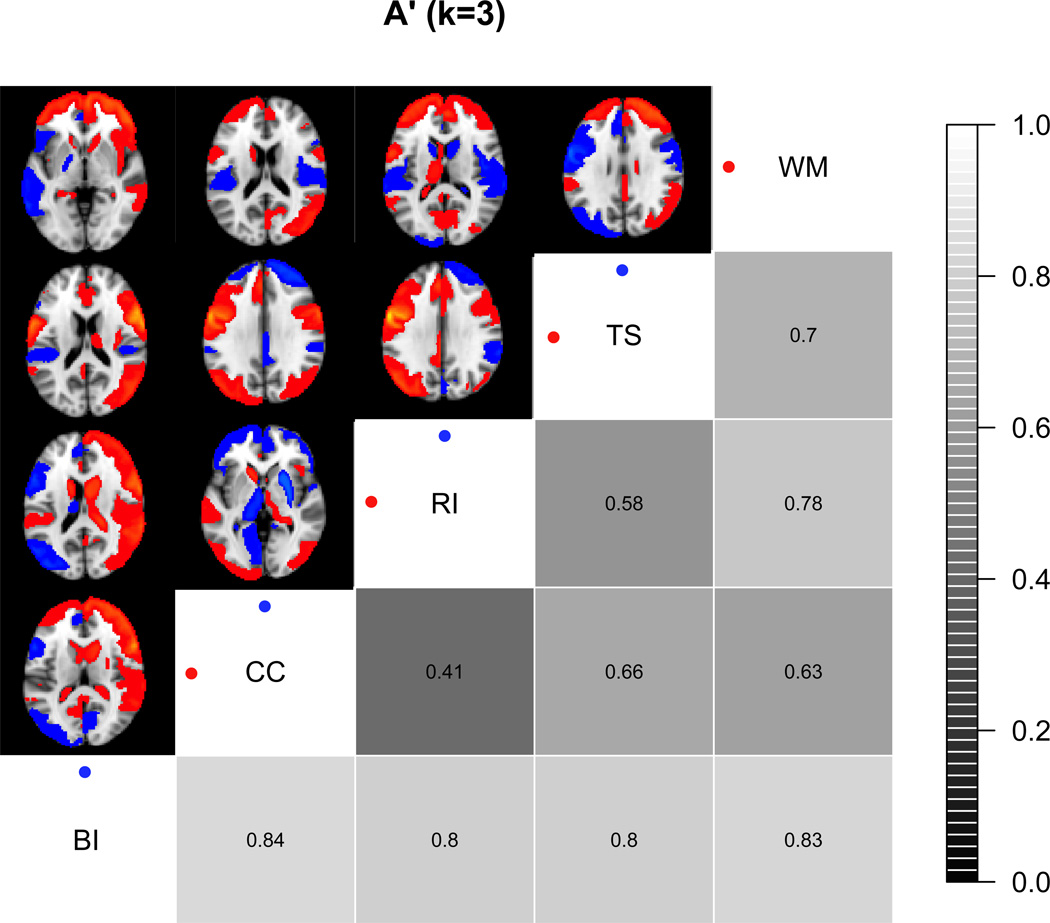
Figure 3.
Selectivity analysis of several mental concepts using the BrainMap database Lenartowicz et al. (from 2010). Discriminability (A’) values were obtained using a k-nearest neighbor classifier (k=3). The bottom right triangle of the figure is a gray scale depiction of A’ values, with brighter tones denoting greater discriminability. The top left triangle is a reconstruction of which regions provided discriminability between each pair of concepts. WM: working memory, TS: task switching, RI: response inhibition, CC: cognitive control, BI: bilingual language.

