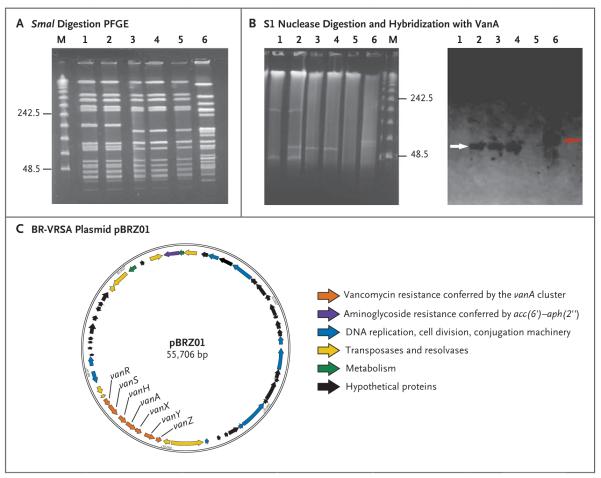
Figure 2. Results of Pulsed-Field Gel Electrophoresis (PFGE), S1 Nuclease Digestion of Total DNA, Hybridization, and Plasmid Annotation.
Panel A shows the results of SmaI digestion of total DNA followed by PFGE. Lane M shows the lambda ladder (with the molecular sizes in kilobases shown at left); lane 1, BR-VSSA; lane 2, BR-VRSA (donor); lane 3, transconjugant number 1 Staphylococcus aureus RN4220-RF; lane 4, transconjugant number 2 S. aureus RN4220-RF; lane 5, S. aureus RN4220-RF (recipient); and lane 6, vancomycin-resistant Enterococcus faecalis (vanA). Panel B shows the results of S1 digestion of the total DNA of staphylococcal strains and vancomycin-resistant E. faecalis followed by PFGE (at left) and hybridization with a VanA probe (at right). In the results at left, lane 1 shows BR-VSSA; lane 2, BR-VRSA (donor); lane 3, transconjugant number 1 S. aureus RN4220-RF; lane 4, transconjugant number 2 S. aureus RN4220-RF; lane 5, S. aureus RN4220RF (recipient); lane 6, vancomycin-resistant E. faecalis; and lane M the lambda ladder. In the results at right, the white and red arrows highlight the positive signal for vanA hybridization in staphylococcal and enterococcal strains, respectively. Panel C shows a schematic representation of the annotation of the BR-VRSA plasmid pBRZ01.

